
Racial/Ethnic and Socioeconomic Status Differences in Voting Behavior in the 2024 Presidential Election
INTRODUCTION
Voting constitutes a core responsibility of citizens in choosing political leaders and remains central to civic participation in democratic societies. However, individuals’ choices at the ballot box are shaped by multiple social and political factors. Understanding these factors is critical for explaining voter behavior. Using data from the 2024 American National Election Studies (ANES) Time Series Study, this article examines the social determinants of voting behavior in the 2024 U.S. presidential election. Specifically, the study assesses the role of race/ethnicity and socioeconomic status (SES) and evaluates their relative importance in shaping electoral participation and vote choice.
Social identities play important roles in shaping voting decisions. Prior research has highlighted the influence of race/ethnicity, gender, and social class on political behavior (Huddy, 2013). Studies have shown that racial and ethnic identities shape political preferences, although findings vary across groups. For example, Black racial identity and linked fate have been associated with group solidarity, political preferences, and participation (Harris, 2011; Harris & Rivera-Burgos, 2021; White et al., 2014). Latino-linked fate appears to be shaped by economic marginalization and immigration experiences (Sanchez &
Masuoka, 2010). Among Asian Americans, panethnic identity is relatively weak, with substantial variation across subgroups (Wong et al., 2011).
Members of minority groups often support candidates or policies attentive to racial and ethnic equality and social justice (Hajnal et al., 2017). Marginalized communities also tend to support policies addressing discrimination, immigration, and criminal justice reform (Barreto et al., 2009). Research on white identity shows that strong white racial consciousness predicts support for restrictive
immigration policies and for candidates such as Donald Trump (Harris & Rivera-Burgos, 2020; Jardina, 2019; Sides et al., 2017). However,
white identity appears unrelated to policies that benefit minority groups, such as affirmative action (Harris & Rivera-Burgos, 2020).
SES has also been linked to political behavior. Education strongly predicts voter turnout, whereas income and occupational class show weaker associations (Wolfinger & Rosenstone, 1980). SES more broadly predicts political involvement, efficacy, and participation (Verba & Nie, 1987).
Income predicts partisanship, with partisan stratification by income increasing over time (Bartels, 2016; McCarty et al., 2006). Research further shows that affluent individuals participate more actively in politics and wield greater political influence (Schlozman et al., 2018).
The relationship between race/ethnicity and voting behavior is complex, with SES and other factors intersecting to shape political engagement (Fraga et al., 2011). Recent research shows that income predicts voting for whites but has weaker effects among Black voters (Laurison et al., 2022). Other studies find that many Black Americans identify more strongly with social class than racial identity (Harris & McKenzie, 2015).
In addition to race/ethnicity and SES, other factors influence voting, including gender, age, political ideology, personality, emotional intelligence, religion, media, social networks, party identification, candidate characteristics, and economic conditions (Kulachai et al., 2023). This article focuses primarily on race/ ethnicity and SES and addresses four research questions:
-
Were there significant racial/ethnic differences in voting behavior in the 2024 presidential election?
-
How did SES influence voting behavior, and did SES explain racial/ethnic disparities?
-
Did personal attitudes—including trust in government, interpersonal trust, political interest, and religious importance—influence voting behavior, and did these factors explain racial/ethnic differences?
-
Did racial/ethnic gaps in voting persist after accounting for demographic and contextual variables such as age, sex, marital status, homeownership, residential stability, party identification, and region?
DATA AND METHODS
DATA
This study uses the 2024 ANES Time Series Study, which employed a mixed-mode design consisting of face-to-face, web, video, phone, and paper-and-pencil interviews. The pre-election survey was conducted from August 3 to November 5, 2024, and the post-election survey was conducted from November 7, 2024, to February 17, 2025. The pre-election sample includes 5,521 respondents, and the post-election sample includes 4,964 respondents. The final analytic sample consists of 4,955 respondents who reported whether they voted in the 2024 presidential election. Weighted descriptive statistics are presented in Table 1.
RESULTS
The primary dependent variable is whether respondents voted in the 2024 presidential election. Overall, 80% reported voting. Figure 1 shows voting rates by race/ethnicity: African Americans (76.8%), Latinos (67.9%), and Native Americans (60.1%) were less likely to vote compared with non-Hispanic whites (83.2%).
RACIAL/ETHNIC DIFFERENCES IN VOTING
Model 1 (Table 2) shows that African Americans, Latinos, and Native Americans had significantly lower odds of voting than non- Hispanic whites. African Americans had 33% lower odds, Latinos 57% lower odds, and Native Americans 70% lower odds of voting.
SOCIOECONOMIC STATUS AND VOTING
Models 2 and 3 incorporate SES variables. Higher educational attainment strongly predicted voting. Individuals with a high school diploma or equivalent were twice as likely to vote as those with less than a high school education; those with a bachelor’s degree or higher were 6.3 to 9.9 times more likely to vote. Household income also predicted voting. Individuals with incomes of $60,000 or more were significantly more likely to vote than those earning less than $30,000.
OTHER PREDICTORS OF VOTING BEHAVIOR
Model 4 shows that trust in government, interpersonal trust, political interest, and religious importance all positively predicted voting. Age, homeownership, and residential stability also increased the likelihood of voting. Living in the South decreased the likelihood of voting as compared to living in the Northeast.
CANDIDATE CHOICE: KAMALA HARRIS VS. DONALD TRUMP
Table 3 shows that African Americans and Latinos were significantly more likely to vote for Harris than whites, and significantly less likely to vote for Trump. SES predicted candidate choice: Higher education and higher income increased the likelihood of voting for Harris. Trust in government, interpersonal trust, political interest, and religious importance also predicted differences in candidate support. Figures 2–4 illustrate predicted probabilities of voting and candidate choice by race/ethnicity after adjustment for covariates
DISCUSSION AND CONCLUSION
This article examined how race/ethnicity, SES, and individual attitudes influenced voting behavior in the 2024 presidential election. African Americans, Latinos, and Native Americans were less likely to vote than whites, although these differences diminished for African Americans and Native Americans after accounting for SES and other confounders. Latinos remained significantly less likely to vote even after adjustments.
SES—particularly education and income—was strongly associated with turnout and partially explained racial/ethnic disparities. Trust in government, interpersonal trust, political interest, and religious importance also predicted voting.
Patterns in candidate choice differed markedly by race/ethnicity and SES. African Americans and Latinos were significantly more likely to vote for Harris and less likely to vote for Trump than whites. Individuals with higher education and income were also more likely to support Harris.
These findings underscore the importance of social identities, SES, and political attitudes in shaping voting behavior. Efforts to increase voter participation should consider these structural and attitudinal differences to strengthen democratic engagement.
Table 1. Descriptive Statistics of Selected Characteristics for the Weighted Sample (N = 4,955)
|
Variables |
Minimum |
Maximum |
Mean or Proportion |
Std. Err. |
|---|---|---|---|---|
|
Voted |
0 |
1 |
79.8% |
|
|
Race/Ethnicity |
||||
|
White, not Hispanic |
0 |
1 |
64.00 |
|
|
African American |
0 |
1 |
11.48 |
|
|
Latino/Hispanic |
0 |
1 |
13.79 |
|
|
Asian or Native Hawaiian/ |
0 |
1 |
4.63 |
|
|
Native American |
0.48 |
|||
|
Multiple races/not reported |
5.62 |
|||
|
Gender |
||||
|
Male |
0 |
1 |
48.21 |
|
|
Female |
0 |
1 |
51.79 |
|
|
Age (years) |
18 |
80 |
49.30 |
0.413 |
|
Education |
||||
|
< high school |
0 |
1 |
7.58 |
|
|
High school |
0 |
1 |
25.91 |
|
|
Some college |
0 |
1 |
30.70 |
|
|
Bachelor’s degree |
0 |
1 |
21.83 |
|
|
College or higher |
0 |
1 |
13.98 |
|
|
Household income |
||||
|
< $30,000 |
0 |
1 |
10.91 |
|
|
$30,000–$59,999 |
0 |
1 |
16.14 |
|
|
$60,000–$99,999 |
0 |
1 |
20.07 |
|
|
$100,000–$149,999 |
0 |
1 |
19.07 |
|
|
$150,000 or higher |
0 |
1 |
25.05 |
|
|
Income unreported |
0 |
1 |
8.75 |
|
|
Trust in government |
1 |
5 |
3.55 |
0.019 |
|
Interpersonal trust |
1 |
5 |
3.13 |
0.020 |
|
Interest in politics/elections |
1 |
5 |
3.45 |
0.022 |
|
Religion |
1 |
5 |
3.18 |
0.034 |
|
Political party |
||||
|
Democrat |
0 |
1 |
35.53 |
|
|
Independent |
0 |
1 |
30.73 |
|
|
Republican |
0 |
1 |
33.74 |
|
|
Marital status |
||||
|
Married |
0 |
1 |
51.83 |
|
|
Widowed |
0 |
1 |
5.81 |
|
|
Divorced |
0 |
1 |
11.77 |
|
|
Separated |
0 |
1 |
1.64 |
|
|
Never married |
0 |
1 |
28.96 |
|
|
Homeownership |
0 |
1 |
72.72 |
|
|
Years of residence |
||||
|
≤ 5 years |
0 |
1 |
37.79 |
|
|
6–10 years |
0 |
1 |
11.48 |
|
|
11–15 years |
0 |
1 |
14.13 |
|
|
16–20 years |
0 |
1 |
8.40 |
|
|
21 or more years |
0 |
1 |
22.20 |
|
|
Region |
||||
|
Northeast |
0 |
1 |
17.35 |
|
|
Midwest |
0 |
1 |
21.57 |
|
|
South |
0 |
1 |
37.59 |
|
|
West |
0 |
1 |
23.49 |
Source: American National Election Studies. 2025. ANES 2024 Time Series Study, August 8, 2025, version. www.electionstudies.org.
Table 2. Logistic Regression of Voting in the 2024 Presidential Election, 2024 (Odds Ratios)
|
Industry |
Model 1 |
Model 2 |
Model 3 |
Model 4 |
Model 5 |
|---|---|---|---|---|---|
|
Race/ Ethnicity |
Education |
Household Income |
Interest in Politics & Religion |
Controls |
|
|
African American |
0.667** |
0.735* |
0.796 |
0.747 |
1.003 |
|
Latino/Hispanic |
0.426*** |
0.460*** |
0.456*** |
0.478*** |
0.586** |
|
Native American or other |
0.304* |
0.268* |
0.336† |
0.284 |
0.461 |
|
Asian or Native Hawaiian/ |
1.069 |
0.790 |
0.731 |
0.754 |
0.767 |
|
Multiple races |
0.628† |
0.628† |
0.619† |
0.611 |
0.787 |
|
High school |
1.974*** |
1.677* |
1.514† |
1.613* |
|
|
Some college |
3.252*** |
2.563*** |
2.313*** |
2.469** |
|
|
Bachelor’s degree |
6.294*** |
4.358*** |
3.589*** |
4.182*** |
|
|
College or higher |
9.935*** |
6.258*** |
3.959*** |
4.300*** |
|
|
$30,000 - $59,999 |
1.165 |
1.024 |
1.121 |
||
|
$60,000 - $99,999 |
1.523* |
1.451* |
1.405† |
||
|
$100,000 - $149,999 |
2.377*** |
2.042** |
1.869** |
||
|
$150,000 or higher |
2.493*** |
2.252*** |
2.018*** |
||
|
Income unreported |
1.927** |
1.617* |
1.515 |
||
|
Trust in government |
1.319*** |
1.195** |
|||
|
Interpersonal trust |
1.213** |
1.232** |
|||
|
Interest in politics/elections |
1.849*** |
1.664*** |
|||
|
Religion |
1.095* |
1.043 |
|||
|
Male |
0.976 |
||||
|
Age (years) |
1.021*** |
||||
|
Widowed |
1.158 |
||||
|
Divorced |
0.878 |
||||
|
Separated |
0.612 |
||||
|
Never married |
1.127 |
||||
|
Homeownership |
1.716*** |
||||
|
Residence: 6 – 10 years |
1.581* |
||||
|
Residence: 11 – 15 years |
1.094 |
||||
|
Residence: 16 – 20 years |
1.264 |
||||
|
Residence: 21 or more years |
1.819** |
||||
|
Party ID -- Democrat |
1.112 |
||||
|
Party ID -- Independent |
0.455*** |
||||
|
Midwest |
0.931 |
||||
|
South |
0.564*** |
||||
|
West |
0.911 |
||||
|
Constant |
4.950*** |
1.579*** |
1.195 |
0.046*** |
0.031*** |
|
F |
8.83*** |
16.95*** |
13.31*** |
16.83 |
14.22*** |
|
Prob. > F |
.000 |
.000 |
.000 |
.000 |
.000 |
Table 3. Logistic Regression of Voting in the 2024 Presidential Election for Kamala Harris and Donald Trump, 2024 (Odds Ratios)
|
Variables |
Kamala Harris |
Donald Trump |
|---|---|---|
|
Black, not Hispanic |
9.375*** |
0.057*** |
|
Latino/Hispanic |
1.863*** |
0.374*** |
|
Native American |
0.927 |
0.519 |
|
Asian |
1.223 |
1.021 |
|
Other races |
1.008 |
0.728 |
|
High school |
1.659† |
1.202 |
|
Some college |
2.403** |
1.091 |
|
Bachelor’s degree |
4.594*** |
0.782 |
|
College or higher |
6.896*** |
0.420*** |
|
$30,000 - $59,999 |
0.999 |
1.328† |
|
$60,000 - $99,999 |
1.564* |
1.070 |
|
$100,000 - $149,999 |
1.497† |
1.255 |
|
$150,000 or higher |
1.949*** |
1.025 |
|
Income unreported |
1.186 |
1.157 |
|
Trust in government |
2.014*** |
0.579*** |
|
Interpersonal trust |
1.201** |
0.994 |
|
Interest in politics/elections |
1.357*** |
1.128* |
|
Religion |
0.587*** |
1.718*** |
|
Male |
0.592*** |
1.574*** |
|
Age (years) |
1.020*** |
0.996 |
|
Widowed |
1.456† |
0.958 |
|
Divorced |
1.052 |
0.993 |
|
Separated |
0.819 |
0.610 |
|
Never married |
1.876*** |
0.645** |
|
Homeownership |
1.200 |
1.496** |
|
Residence: 6 – 10 years |
1.060 |
1.530** |
|
Residence: 11 – 15 years |
0.841 |
1.499** |
|
Residence: 16 – 20 years |
1.257 |
0.975 |
|
Residence: 21 or more years |
1.152 |
1.202 |
|
Party ID -- Independent |
0.720** |
0.598*** |
|
Midwest |
1.040 |
1.081 |
|
South |
0.616*** |
1.099 |
|
West |
0.937 |
0.933 |
|
Constant |
0.010*** |
0.235*** |
|
F |
21.24*** |
21.49*** |
|
Prob. > F |
.000 |
.000 |
Figure 1. Percent Voted in the 2024 Presidential Election by Race/Ethnicity.
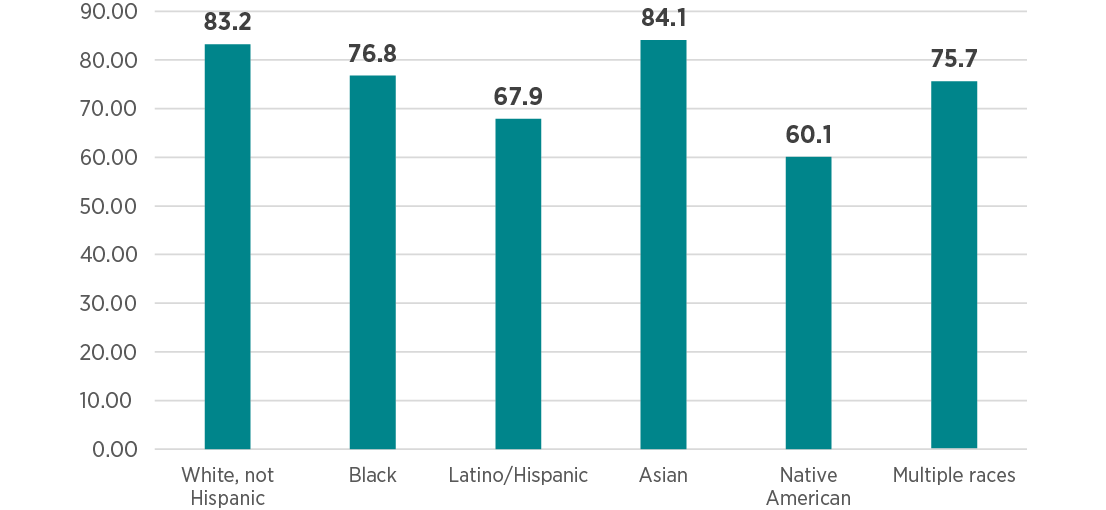
Figure 2. Adjusted Mean Predicted Probabilities of Voting in the 2024 Presidential Election by Race/Ethnicity.
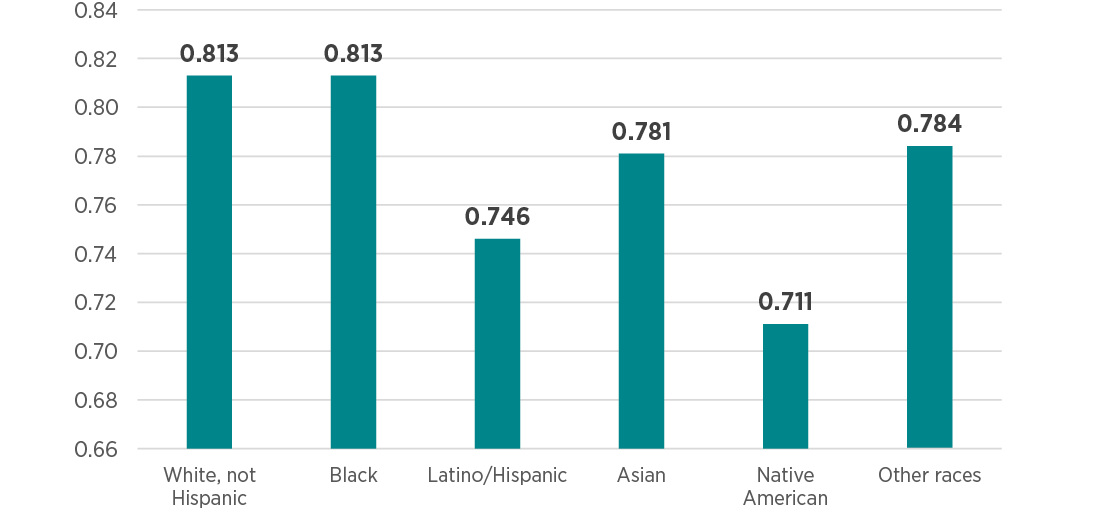
Figure 3. Adjusted Mean Predicted Probabilities of Voting for Kamala Harris by Race/Ethnicity.

Figure 4. Adjusted Mean Predicted Probabilities of Voting for Donald Trump by Race/Ethnicity.

References
American National Election Studies. (2025). ANES 2016–2020–2024 panel study merged file [Dataset and documentation]. https://electionstudies.org
Barreto, M. A., Nuno, S., & Sanchez, G. R. (2009). The mobilization of Latino voters: A field experiment. American Political Science Review, 103(3), 407–429.
Bartels, L. M. (2016). Unequal democracy: The political economy of the new gilded age. Princeton University Press.
Berry, J. A., Ebner, D., & Cornelius, M. (2021). White identity politics: Linked fate and political participation. Politics, Groups, and Identities.
Fraga, L. R., Garcia, J. A., Hero, R. E., Jones-Correa, M., Martinez-Ebers, V., & Segura, G. M. (2011). Latinos in the new millennium: An almanac of opinion, behavior, and policy preferences. Cambridge University Press.
Hajnal, Z., Lajevardi, N., & Nielson, L. (2017). Voter identification laws and the suppression of minority votes. The Journal of Politics, 79(2), 363–379.
Harris, F. C. (2011). The contours of Black public opinion. In G. C. Edwards, L. R. Jacobs, & R. Y. Shapiro (Eds.), The Oxford handbook of American public opinion and the media. Oxford University Press.
Harris, F. C., & McKenzie, B. D. (2015). Unreconciled strivings and warring ideals: The complexities of competing African American political identities. Politics, Groups, and Identities, 3(2), 239–254.
Harris, F. C., & Rivera-Burgos, V. (2021). The continuing dilemma of race and class in the study of American political behavior. Annual Review of Political Science, 24(1), 175–191.
Huddy, L. (2013). From group identity to political cohesion and commitment. In The Oxford handbook of political psychology (2nd ed., pp. 361–392). Oxford University Press.
Jardina, A. (2019). White identity politics. Cambridge University Press. Kulachai, W., Lerdtomornsakul, U., & Homyamyen, P. (2023). Factors influencing voting decisions: A comprehensive literature review. Social Sciences, 12(9), 469.
Laurison, D., Brown, H., & Rastogi, A. (2022). Voting intersections: Race, class, and participation in presidential elections in the United States 2008–2016. Sociological Perspectives, 65(4), 768–789.
McCarty, N., Poole, K. T., & Rosenthal, H. (2016). Polarized America: The dance of ideology and unequal riches. MIT Press.
Sanchez, G. R., & Masuoka, N. (2010). Brown-utility heuristic? The presence and contributing factors of Latino linked fate. Hispanic Journal of Behavioral Sciences, 32(4), 519–531.
Schlozman, K., Brady, H., & Verba, S. (2018). Unequal and unrepresented: Political inequality and the people’s voice in the new gilded age. Princeton University Press.
Sides, J., Tesler, M., & Vavreck, L. (2018). Hunting where the ducks are: Activating support for Donald Trump in the 2016 Republican primary. Journal of Elections, Public Opinion and Parties, 28(2), 135–156.
Verba, S., & Nie, N. H. (1987). Participation in America: Political democracy and social equality. University of Chicago Press.
White, I. K., Laird, C. N., & Allen, T. D. (2014). Selling out? The politics of navigating conflicts between racial group interest and self-interest. American Political Science Review, 108(4), 783–800.
Wolfinger, R. E., & Rosenstone, S. J. (1980). Who votes? Yale University Press.
Wong, J. S., Ramakrishnan, S. K., Lee, T., Junn, J., & Wong, J. (2011). Asian American political participation: Emerging constituents and their political identities. Russell Sage Foundation.