
Race/Ethnicity, Residence, and Underemployment

INTRODUCTION
According to Jensen and Slack (2003), measurement of the unemployment rate came about in response to the “economic turmoil of the Great Depression” (p. 21). Prior to the Great Depression, able-bodied people were considered lazy if they were unable to find work, but the economic catastrophe forced Americans to change the way they viewed poverty. Consequently, the industrialized nations of the West began to collect unemployment statistics in the 1930s “to gauge the performance of the labor market and the social circumstances of its workers” (p. 21). Despite these new statistics, however, labor market analysts realized that unemployment rates did not provide the entire scope of employment hardships. In addition to unemployment, underemployment is a major component of inadequate employment. The issue of underemployment gained increased traction during the economic recession of the 1980s when scholars began to turn their attention to the worsening economic conditions in rural areas. Poverty rates were high not only in cities (Wilson, 1987), but also in nonmetropolitan areas (Lichter and Costanzo, 1987; Slack & Jensen, 2002).
High rates of poverty for racial/ethnic minorities (especially African Americans, Latinos, and Native Americans) in rural areas are exacerbated by the inability to find a job, as well as poor job quality in current employment (Slack and Jensen, 2002). Underemployment has split the system into “good jobs” and “bad jobs.” As Jensen and Slack (2003) explain: “[g]ood jobs are stable, full-time, and well-paying, offer advancement opportunities, and tend to be held by those who are highly skilled and/or well educated. Bad jobs tend to be unstable, poorly paying, and often part-time, and they are lacking in benefits and prospects for advancement” (p. 22).
Labor force inadequacy is often explained by lack of skills and education. From the human capital theory, workers with low skills and education are considered less competitive in the labor market and therefore have more job instability when compared with workers who are more skillful, educated, and experienced. The main critique of that perspective is that structural factors such as social, economic, or political systems exacerbate the employment status of workers. For example, racial or ethnic groups such as African Americans and Latinos have a more difficult time obtaining adequate employment or “good jobs” that provide benefits and stable, livable wages when compared with whites. Women also face similar difficulties in finding and obtaining adequate employment, particularly if they are the head of the household and have young children, when compared with their white male counterparts (McCall, 2001).
Beyond individual characteristics of workers, structural hurdles remain that prevent racial/ethnic minorities from obtaining adequate employment. Even after controlling for education and other covariates, Blacks and Hispanics are more likely than non-Hispanic whites to be underemployed (Slack & Jensen, 2002). The likelihood of underemployment across different minority groups when compared to non-Hispanic whites is not fully accounted for by human-capital, demographic, industry, and occupational factors (De Jong and Madamba, 2001). Interracial/ethnic disparities persist in the labor market even after controlling for human capital factors such as education and age (Zhou, 1993).
Industrial restructuring of the U.S. economy has exacerbated racial/ethnic differences in underemployment. Workers who once found reasonably good employment in manufacturing in the inner cities have been disproportionately affected by the shifting industrial structure of the economy. Manufacturing industries that once employed large numbers of people in metropolitan areas have shifted outside of large cities and to other countries. In part, this was exacerbated by globalization, as multinational enterprises moved their factories to other countries where they can obtain cheaper labor. In place of these manufacturing positions, an influx of service positions came available in the inner cities, the only option that many disadvantaged workers had in terms of employment opportunities as many lacked the necessary education or skills for other jobs (Mouw, 2000). Minorities have also been vulnerable to other structural economic changes, such as the shift from goods-producing to service-producing industries. After the decline of high-paying manufacturing positions in the 1980s, a new economy developed of high-skill service industries that emphasized technological skills. As a result, the new economy aggravated the effects of the deindustrialization period on workers unqualified for these new positions.
Spatial theories of poverty emphasize that opportunities for employment are unevenly distributed across space. Adequate employment opportunities are in shorter supply in rural areas than in urban areas. Jobs in rural areas are more likely to pay lower wages, to be seasonal or unstable, and are less likely to offer unionization or pension benefits (Jensen et al., 1999). Whereas rural economies once relied upon agricultural and natural resources-based industries, economic restructuring introduced a range of new industries that were more susceptible to external economic conditions. Although some rural workers found employment opportunities in these new industries, not all workers benefited since many of these jobs necessitated specific skill sets or educational requirements. Lichter and Costanzo (1987) found a higher prevalence of discouraged workers, unemployment, and underemployment by low hours and low income in nonmetropolitan areas than in metropolitan areas.
While individual factors partially explain underemployment, they are not enough to explain why certain groups of people consistently experience inadequate employment. The U.S. economy is experiencing structural changes that split the workforce into “good” and “bad” jobs. The objectives of this study are threefold: 1) to determine the rate of underemployment in the U.S. and how it differs by race/ethnicity; 2) to determine how the rate of underemployment varies by residence, and 3) to determine whether the rate of underemployment varies by race/ethnicity across residential settings.
DATA AND METHODS
DATA
The data for this analysis are drawn from the 2022-2024 Annual Social and Economic (ASEC) survey files of the March supplements of the Current Population Survey (CPS). The Current Population Survey is a monthly survey of approximately 54,000 households conducted by the Bureau of the Census. The CPS includes a sample of noninstitutionalized, civilian respondents and interviews respondents age 15 or older within each household about their employment status. The data includes estimates for the nation, as well as for individual states and geographic areas. The March supplements of the survey gather more detailed information about income and work experiences in the U.S. and include sociodemographic characteristics such as age, sex, race, household relationship, and Hispanic origin for each person in the household enumerated.
KEY VARIABLES
Underemployment
The primary outcome is underemployment. The CPS is well suited to operationalize underemployment using the Labor Utilization Framework (LUF) originally developed by Hauser (1974) and expanded by Clogg and colleagues (Clogg and Sulivan, 1983; Clogg, Sullivan, and Mutchler, 1986). Drawing on the LUF measure, underemployment is operationalized using five mutually exclusive labor force categories of workers: 1) Sub-unemployment or discouraged workers are those who are not currently working and would like to work but are not actively seeking a job because they believe that none are available. 2) Unemployed workers are those who are not currently working but are actively looking for work or are on layoff. 3) Involuntary part-time workers are those working less than full-time hours (35 hours per week) but who would opt for full-time employment were it available. 4) Low-income workers (or working poor) are those whose labor market earnings in the previous year (adjusted for weeks and hours worked) were less than 125 percent of the individual poverty threshold. 5) Persons in any of these four groups are said to be economically underemployed. Other employed workers who do not fit the above categories (i.e., those who are working full-time at jobs that pay more than near-poverty level wages or those who have voluntarily chosen to work part-time) are defined as adequately employed.
Race/Ethnicity
Race/ethnicity is constructed using CPS items on race and Hispanic ethnicity. First, Latino workers are distinguished from non-Latino workers. Second, non-Latino workers are categorized by race to include non-Hispanic white alone; non-Hispanic Black alone; Asian alone; Native American or in combination with other races; Native Hawaiian or Pacific Islander or in combination with other races; and other mixed races.
Nonmetropolitan/metropolitan residence
This variable distinguishes individuals living in nonmetropolitan areas from those living in metropolitan areas. For the latter category, the analysis further distinguishes those living in central cities from those living outside central-city metropolitan areas. A small percentage of CPS households are not identified on the residence variable. To protect the respondents’ confidentiality, these cases are not included in the descriptive tables but are included in multivariate analysis.
ANALYTICAL STRATEGY
The analysis is comprised of both descriptive and multivariate statistical techniques. The study uses cross-tabulations to describe the prevalence of underemployment by race/ethnicity and by metropolitan/nonmetropolitan residence. In addition, descriptive statistics include two measures of inequality: 1) the ratio between minority and underemployment rates; and 2) the difference between minority and white underemployment rates. The study also uses logistic regression models to estimate the probability that a worker will be underemployed and assess the relative and combined effects of race/ethnicity and residence status, controlling for sociodemographic characteristics. The analytical strategy is to use nested modeling to explain minority disadvantages in the risk of being underemployed, as well as residence-specific differences in the effect of race/ethnicity on underemployment (the results for logistic regression models are available upon request).
RESULTS
What is the prevalence of underemployment in the United States and how does it vary across racial/ethnic groups and residence?
About 20% of civilians in the modified labor force 16 years or older were economically underemployed, including discouraged workers, involuntary part-time workers, unemployed workers, and the working poor. Blacks, Latinos, and Native Americans had higher rates of underemployment than their white counterparts. About 23% of Black and 25% of Latino and Native American workers were underemployed compared to 18% of white workers. In contrast, Asian workers had slightly lower rates of underemployment than their white counterparts (Figure 1). Overall, underemployment rates are higher in nonmetropolitan areas than in central-city and noncentral-city metropolitan areas. About 23% of workers in nonmetro areas were underemployed compared to 21% in central-city metro areas and 19% in noncentral-city metro areas (Figure 2).
Figure 1. Prevalence of Underemployment (any type) by Race/Ethnicity, 2022-2024
-by-Race-Ethnicity,-2022-2024.png)
Figure 2. Prevalence of underemployment (any type) by Nonmetropolitan/Metropolitan Residence, 2022-2024
-by-Nonmetropolitan-Metropolitan-Residence,-2022-2024.png)
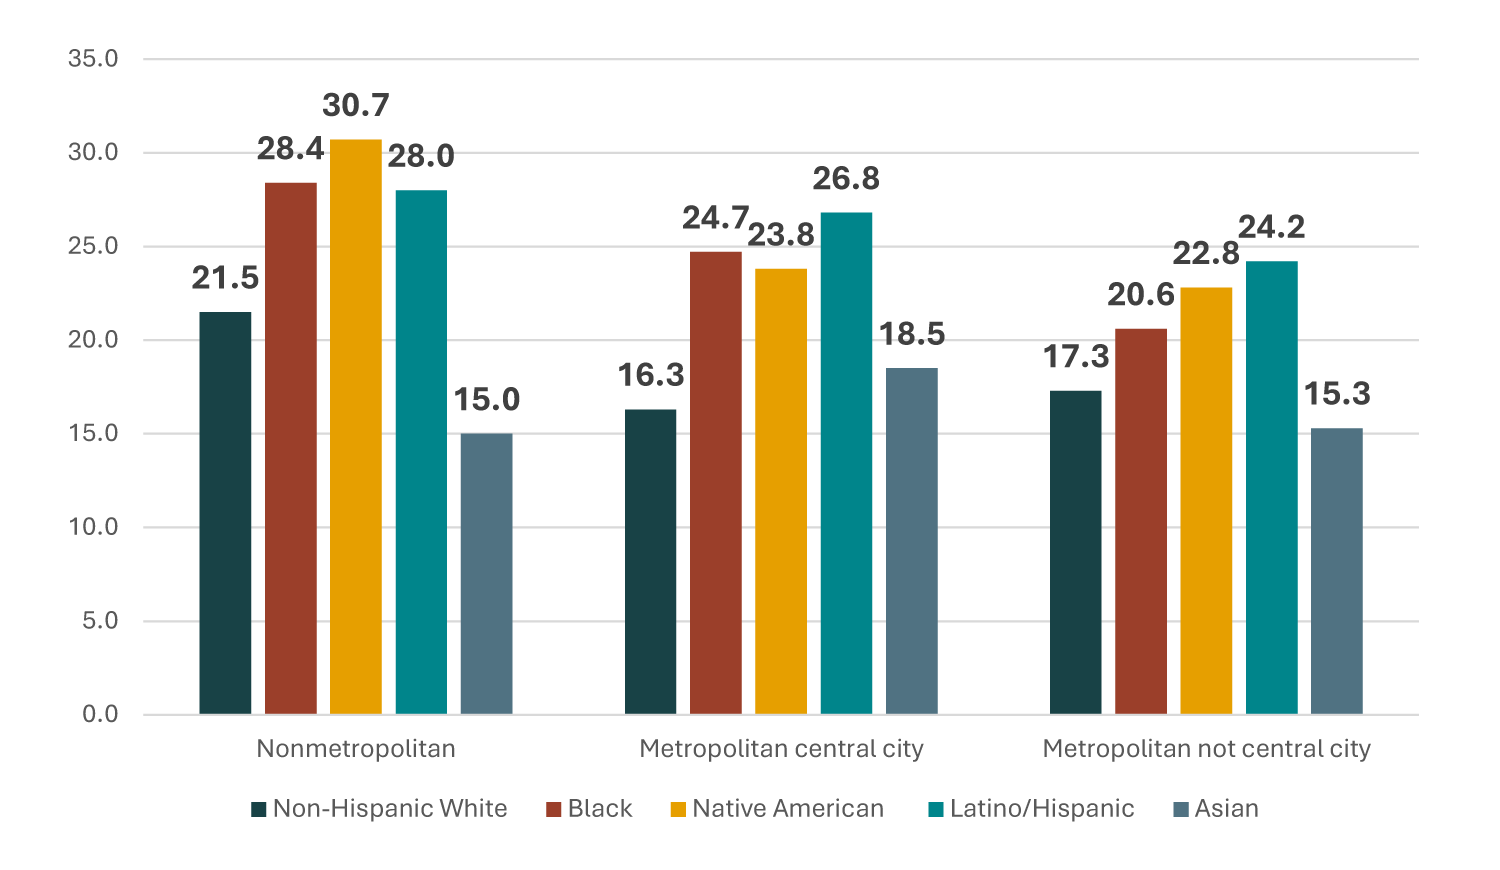
Nonmetro racial/ethnic minorities experienced higher rates of underemployment than those in central-city and not central-city metro areas. The underemployment rate for Latinos in nonmetro was 28.0% compared to 26.8% in central-city metro, and 24.2% in not central-city metro areas. For Blacks, the underemployment rate was 28.4% in nonmetro, 24.7% in central-city metro, and 20.6% in not central-city metro areas. For Native Americans, the underemployment rate was 30.7% in nonmetro areas compared to 23.8% in central-city metro, and 22.8% in not central-city metro areas (Figure 3).
Figure 3. Prevalence of underemployment (any type) by Nonmetropolitan/Metropolitan Residence by Race/Ethnicity, 2022-2024
How do the levels of underemployment differ between racial/ethnic minority and white workers?
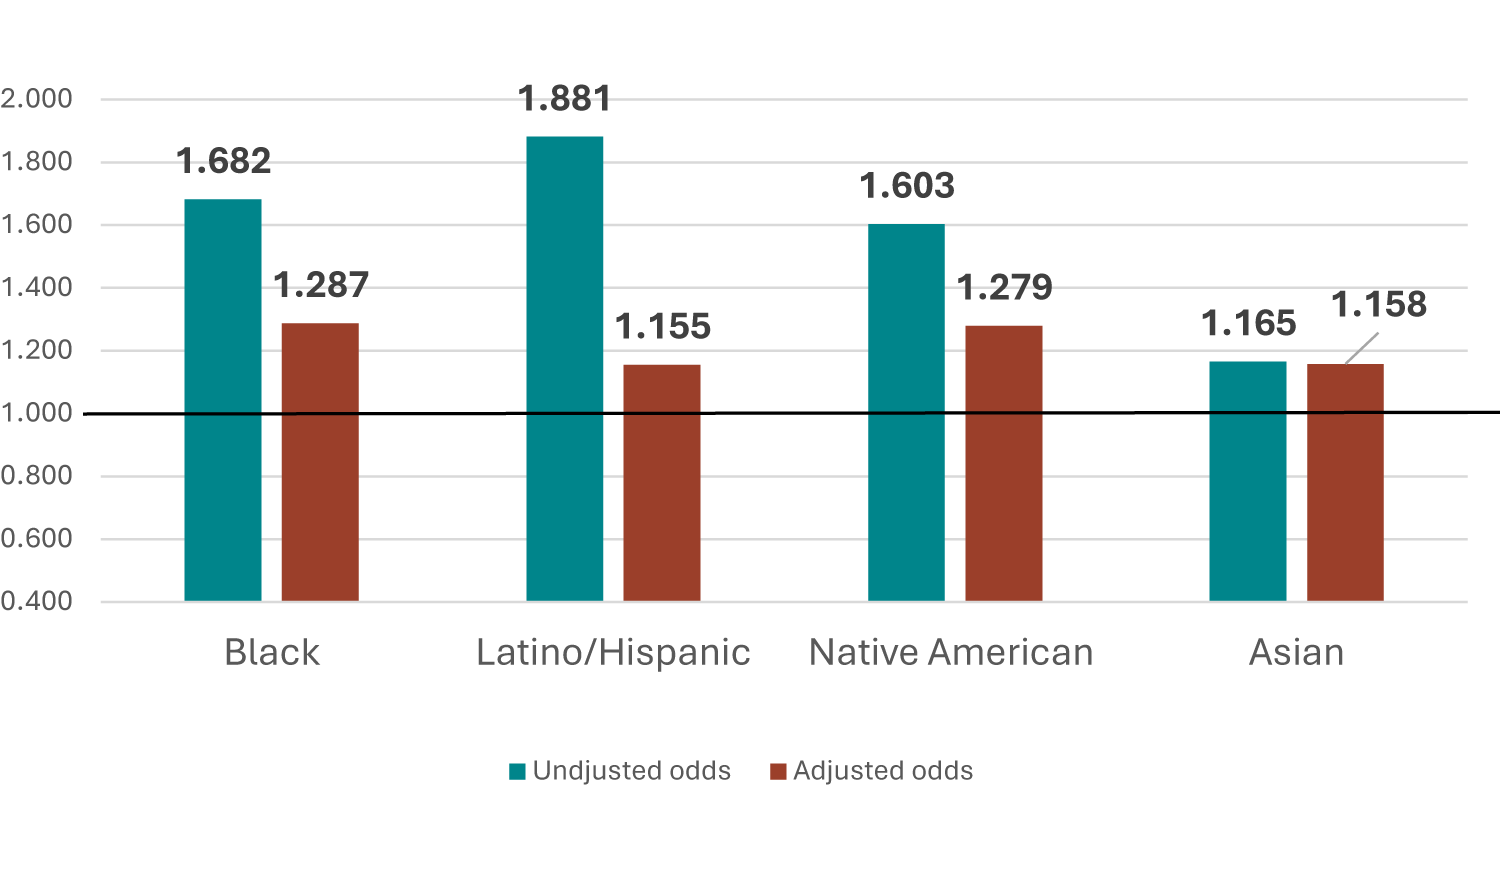
Without adjusting for sociodemographic differences, Latinos, Native Americans, and Blacks are significantly more likely than whites to be underemployed. Latinos are 58%, Native Americans 52%, and Blacks 36% more likely than whites to be underemployed. Asians are 7% less likely than whites to be underemployed (Figure 4). After adjusting for the effects of sociodemographic characteristics including gender, age, marital status, education, industry of employment, region, and nonmetro/metro residence, the odds of underemployment are significantly reduced. Latinos, Blacks, and Native Americans remain significantly more likely to be underemployed than whites. Specifically, Latinos are 8%, Blacks 17%, and Native Americans 20% more likely to be underemployed than whites, respectively (Figure 4), net of effects of sociodemographic variables. Education, especially having a college education or more, followed by working in high-wage services and durable manufacturing, significantly and more than other variables reduces the odds of underemployment and explains racial/ethnic inequality in underemployment (results are available upon request).
Figure 4. Adjusted and Unadjusted Odds Ratios of Underemployment by Race/Ethnicity, 2022 - 2024a
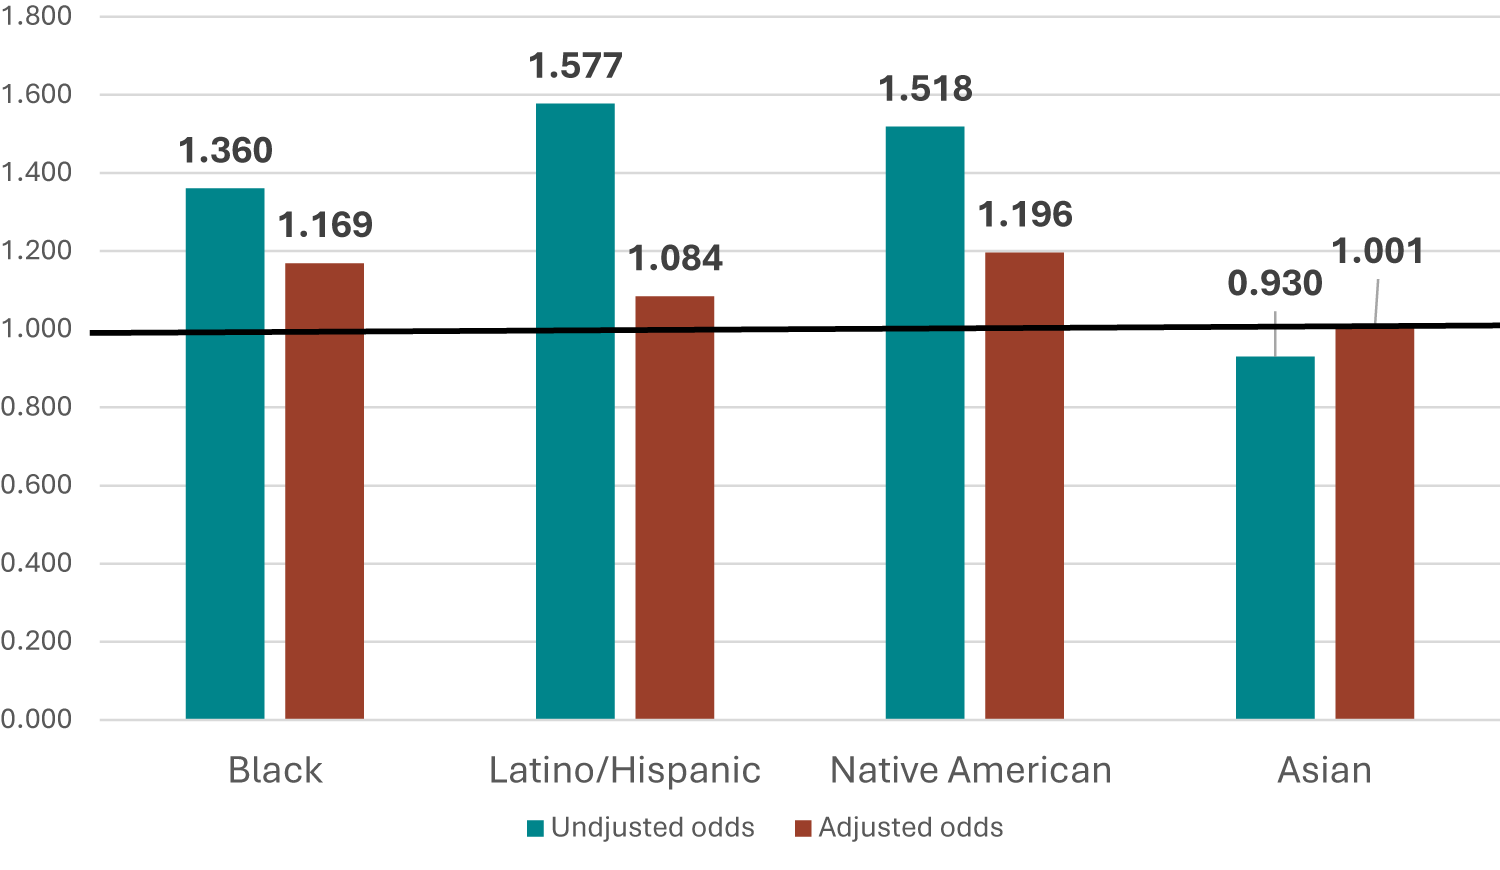
a. Adjusted for the effects of sociodemographic characteristics including gender, age, marital status, education, industry of employment, and region of residence.
How do the levels of underemployment differ between nonmetropolitan and metropolitan residence?
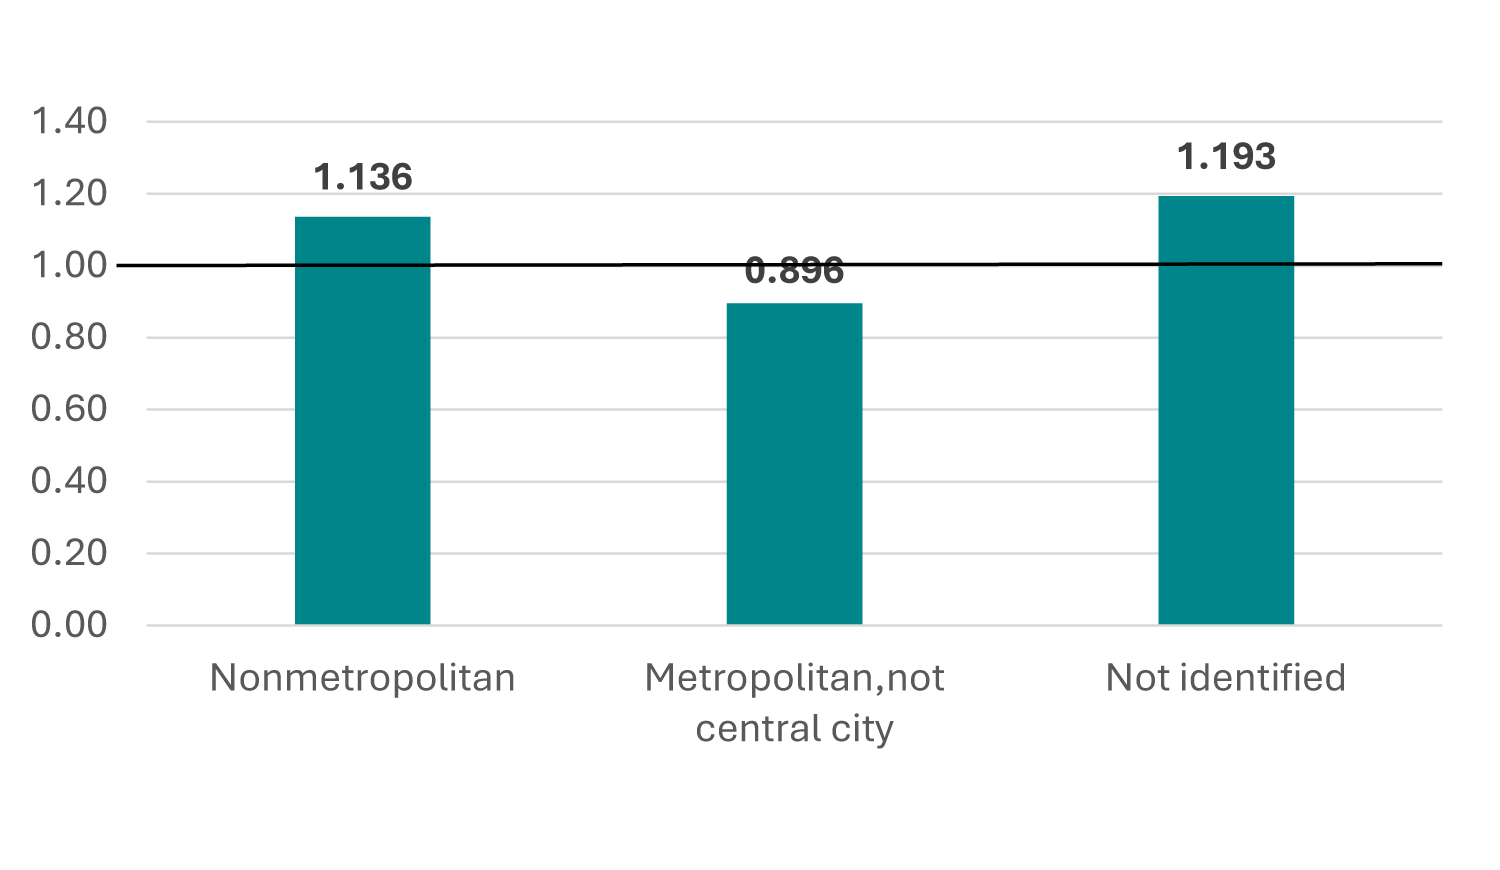
Underemployment rates are significantly higher in nonmetropolitan than in central-city metropolitan areas. In contrast, underemployment rates are significantly lower in noncentral-city metropolitan areas than in central-city metropolitan areas. Workers in nonmetropolitan areas are 14% more likely to be underemployed than those in central-city metropolitan areas. Workers in nonidentified areas are 19% more likely than those in central-city metropolitan areas to be underemployed. Those in noncentral-city metropolitan areas are about 10% less likely to be underemployed than those in central-city metropolitan areas (Figure 5).
Figure 5. Odds Ratios of Underemployment by Nonmetropolitan/Metropolitan Residence, 2022 - 2024
To what extent does the racial/ethnic minority inequality in underemployment vary by nonmetropolitan/metropolitan residence?
The underemployment rate in nonmetropolitan areas varies by race/ethnicity. Blacks, Latinos, and Native Americans in nonmetropolitan areas are more likely than whites to be underemployed. In contrast Asians are less likely than whites to be underemployed. Blacks, Latinos, and Native Americans in nonmetropolitan areas are 45%, 42%, and 62% significantly more likely than their white counterparts to be underemployed, respectively. Asians in nonmetropolitan areas are 36% significantly less likely than whites to be underemployed (Figure 7). The nonmetropolitan racial/ethnic differences in underemployment decreased or are fully accounted for by adjusting for the effects of sociodemographic characteristics. In nonmetro areas, the underemployment rate for Blacks is 39% higher and 51% higher for Native Americans, compared to whites, even after adjusting for the effects of sociodemographic characteristics. The adjusted underemployment rates for Latinos and Asians in nonmetropolitan areas were not significantly different from those of whites (Figure 6).
Figure 6. Unadjusted and Adjusted Odds Ratios of Underemployment by Race/Ethnicity in Nonmetropolitan Area, 2022 - 2024a
a. Adjusted for the effects of sociodemographic characteristics including gender, age, marital status, education, industry of employment, and region of residence.
Blacks, Latinos, Native Americans, and Asians in central-city metropolitan areas are more likely than whites to be underemployed. Blacks, Latinos, Native Americans, and Asians in central-city metropolitan areas are 68%, 88%, 60%, and 17% significantly more likely than their white counterparts to be underemployed, respectively (Figure 8). The underemployment rates for Blacks, Latinos, and Asians in central-city metropolitan areas are reduced but remain significantly higher than that of whites, about 29%, 16%, and 17%, respectively, after adjusting for the effects of sociodemographic characteristics. The adjusted underemployment rates for Native Americans in central-city metropolitan areas were not significantly different from those of whites (Figure 7).
Figure 7. Unadjusted and Adjusted Odds Ratios of Underemployment by Race/Ethnicity in Central-City Metropolitan Areas, 2022 - 2024a
a. Adjusted for the effects of sociodemographic characteristics including gender, age, marital status, education, industry of employment, and region of residence.
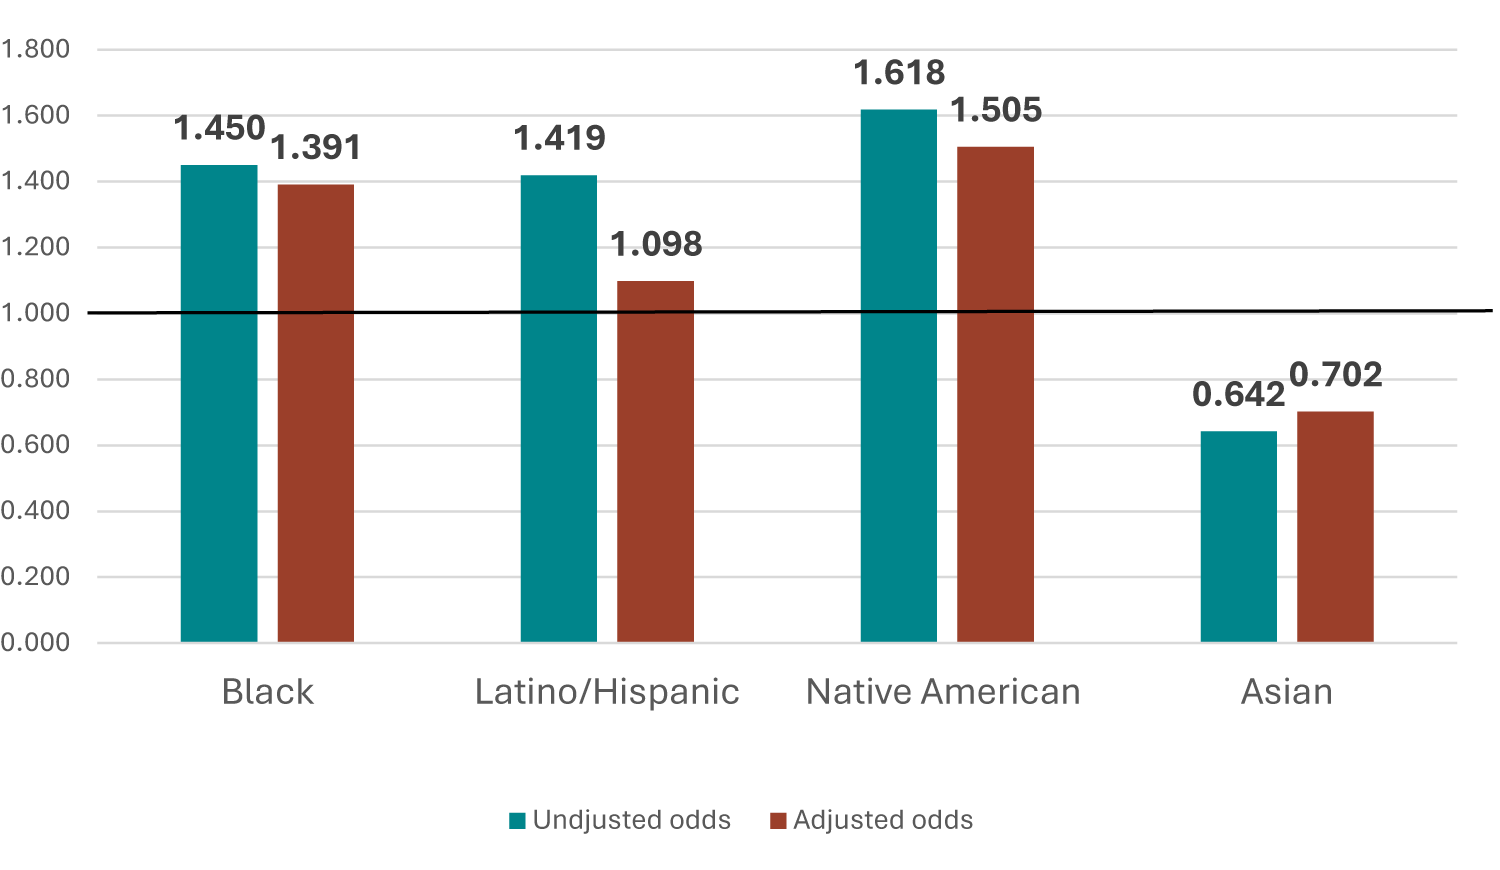
In noncentral-city metropolitan areas, Blacks, Latinos, and Native Americans were more likely than whites to be underemployed. In contrast Asians were less likely than whites to be underemployed. Blacks, Latinos, and Native Americans in noncentral-city metropolitan areas were 24%, 52%, and 41% significantly more likely than their white counterparts to be underemployed, respectively. Asians in nonmetropolitan areas were 14% significantly less likely than whites to be underemployed. After adjusting for the effects of sociodemographic characteristics, Blacks and Asians were barely significantly more or less likely than whites (p < .10) to be underemployed in noncentral-city metropolitan areas, whereas Latinos and Native Americans were not significantly more or less likely than their white counterparts to be underemployed (Figure 8).
Figure 8. Unadjusted and Adjusted Odds Ratios of Underemployment by Race/Ethnicity in Noncentral-City Metropolitan Areas, 2022 - 2024a
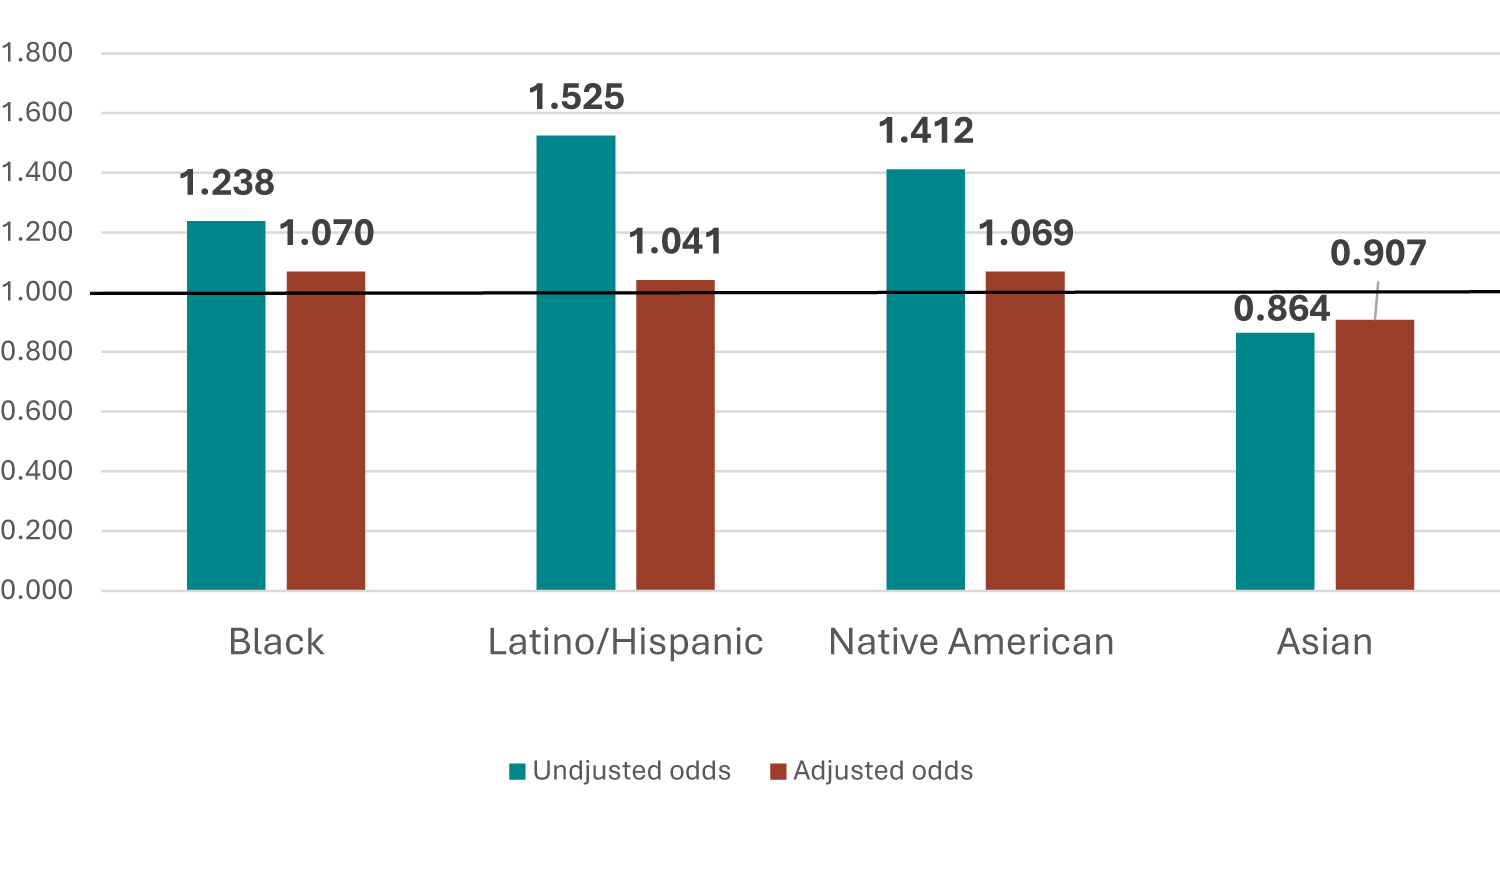
a. Adjusted for the effects of sociodemographic characteristics including gender, age, marital status, education, industry of employment, and region of residence.
DISCUSSION AND CONCLUSION
In this paper, economic hardship is conceptualized, using the Labor Utilization Framework, as underemployment. Using the 2022-2024 Annual Social and Economic (ASEC) survey files of the March supplements of the Current Population Survey (CPS), it is estimated that one fifth of the civilian modified labor force 16 years and older were economically underemployed. That includes discouraged, unemployed, involuntary part-time, and working poor workers. The results show that Blacks, Native Americans, and Latinos experience higher underemployment rates whereas Asians experience lower underemployment rates than their white counterparts. The rate of underemployment for Blacks, Native Americans, and Latinos is lower, but remains significantly higher than those of whites even after adjusting for sociodemographic characteristics and residence, suggesting that race/ethnicity remains a substantial barrier to holding adequate employment.
The results also show that, overall, underemployment rates are significantly higher in nonmetro areas than in central-city and noncentral-city metro areas. The racial/ethnic differences in underemployment vary by metro/nonmetro residence. In nonmetro areas, Blacks, Native Americans, Latinos, and Native Hawaiian or Pacific Islanders were significantly more likely to be underemployed than their white counterparts, whereas Asians were less likely than whites to be underemployed. In central-city metro areas, Blacks, Native Americans, Latinos, and Native Hawaiian or Pacific Islanders were significantly more likely to be underemployed than their white counterparts. Asians in central-city metro areas were also more likely to be underemployed than their white counterparts. In noncentral-city metro areas, Blacks, Native Americans, and Latinos were more likely than whites to be underemployed. In contrast, Asians and Native Hawaiian or Pacific Islanders were less likely than whites to be underemployed.
After adjusting for key sociodemographic characteristics in each area, the underemployment rate for Blacks was significantly higher than that of whites in nonmetro and central-city metro areas, but barely significantly higher that of whites in noncentral-city metro areas. The underemployment rate for Latinos was only significantly higher than that of whites in central-city metro areas after adjustment. The underemployment rate for Native Americans was significantly higher than that of whites only in nonmetro areas, after adjustment. The underemployment rate for Asians was significantly higher than that of whites in central-city metro areas, but barely significantly lower than that of whites in noncentral-city metro areas after adjustment.
These results suggest that both race/ethnicity and the spatial location of employment do matter and remain barriers to holding adequate employment.
These results suggest important considerations for public employment policy. While it is important to create more employment opportunities, marginal employment (discouraged, unemployed, part-time for economic reasons, and low-income workers) remains a serious barrier for many people in satisfying their basic needs. It is crucial to provide adequate employment opportunities—full-time, quality jobs that offer better earning potential.
The results show that racial/ethnic inequalities in adequate employment remain. Blacks, Native Americans, and Latinos are disadvantaged in terms of being adequately employed when compared to whites. There is clearly a need for programs/policies designed to encourage and expand existing quality employment opportunities for disadvantaged groups. The results also highlight spatial economic inequalities associated with lack of better employment opportunities in nonmetro as well as in central-city metro areas. The economic disadvantages of nonmetro and central-city areas require designing economic policies and development programs that focus on increasing adequate employment opportunities in those places. This will require not only creating more jobs, but also quality jobs. There remains a need for initiatives that target areas of persistent rural poverty and disadvantaged central-city areas, which also tend to have a concentration of racial/ethnic minority populations.
Finally, these results illustrate the need for policymakers to continue to advocate and address the problem of marginal employment. There is a need to design programs that reduce racial/ethnic inequalities in adequate employment. In this global and competitive world, society cannot afford the underutilization of its labor force. There is also a need to design programs that reduce uneven development of certain places. Forgotten rural areas and central-city metro areas with high concentrations of poverty can benefit from new and better employment opportunities that offer residents decent and improved living conditions.
References
Clogg, C. C., & Sullivan, T. A. (1983). Labor force composition and underemployment trends, 1969–1980. Social Indicators Research, 12(2), 117-152.
Clogg, C. C., Sullivan, T. A., & Mutchler, J. E. (1986). Measuring underemployment and inequality in the work force. Social Indicators Research, 18, 375-393.
De Jong, G. F., & Madamba, A. B. (2001). A double disadvantage? Minority group, immigrant status, and underemployment in the United States. Social Science Quarterly, 82(1), 117-130.
Hauser, P. M. (1974). The measurement of labor utilization. Malayan Economic Review, 19, 1 - 17.
Jensen, L., & Slack, T. (2003). Underemployment in America: Measurement and evidence. American Journal of Community Psychology, 32(1-2), 21-31.
Jensen, L., Findeis, J. L., Hsu, W. L., & Schachter, J. P. (1999). Slipping Into and Out of Underemployment: Another Disadvantage for Nonmetropolitan Workers? 1. Rural Sociology, 64(3), 417-438.
Julius, W. W. (1987). The truly disadvantaged: The inner city, the underclass, and public policy. Chicago: University of Chicago Press.
Lichter, D. T., & Costanzo, J. A. (1987). Nonmetropolitan underemployment and labor-force composition. Rural Sociology, 52(3), 329.
McCall, L. (2001). Sources of racial wage inequality in metropolitan labor markets: Racial, ethnic, and gender differences. American Sociological Review, 66(4), 520-541.
Mouw, T. (2000). Job relocation and the racial gap in unemployment in Detroit and Chicago, 1980 to 1990. American Sociological Review, 65(5), 730-753.
Slack, T., & Jensen, L. (2002). Race, ethnicity, and underemployment in nonmetropolitan America: a 30-Year profile. Rural Sociology, 67(2), 208-233.
Zhou, M. (1993). Underemployment and economic disparities among minority groups. Population Research and Policy Review, 12, 139-157.