
Latino Population Profiles in Michigan
.jpg)
Introduction
Data from the 2020 Census in the United States show that the Latino population numbered about 62.1 million, representing 18.7% of the total U.S. population. Latinos are the second largest ethnic population in the country after white Americans. They are also the largest ethno-racial minority population, surpassing African Americans in over half of all U.S. metropolitan areas (Frey, 2011). The Latino population in the U.S. increased from 50.5 million in 2010 to 62.1 million in 2020, reflecting a growth rate of 23%. In Michigan, the Latino population in 2020 was about 564,422, or 5.6% of the total population. The Latino population in Michigan increased from 436,358 in 2010 to 564,422 in 2020, a 29.3% change. As of 2022, the Latino population in Michigan has increased to 573,514, or 5.7% of the total population.
Although much has been written about Latinos in the Southwest and West (e.g., Massey, 1987), less is still known about Latino recent migration and settlement in the Midwest. Latinos have settled in nontraditional metropolitan cities, suburbs, and rural areas (Kandel & Parrado, 2006). The Latino population growth in nonmetropolitan county destinations represents one of the more profound social transformations affecting rural places, altering not only their social, economic, and political profiles but also the broader national perception of rural and small America (Kandel and Parrado, 2006).
Historically, Latinos in the United States have concentrated in the largest metropolitan areas in the Southwest (Mexican Americans) and the Northeast (Puerto Ricans). Latinos have traditionally resided in six states: California, Texas, New York, Florida, Illinois, and New Jersey. Within those states, Latinos have tended to concentrate in gateway and ethnic hub cities such as Los Angeles, Houston, Dallas, New York City, Miami, and Chicago. More recently, Latinos have settled in new destinations outside of traditional gateway metropolitan areas, particularly in the Midwest and Southeast, and in both metropolitan and nonmetropolitan areas. They were attracted by, or recruited for, employment opportunities in agriculture, meat packing, other food processing jobs, timber harvesting and processing, and other industries.
According to the 2020 Census, 47.4% of U.S. Latinos resided in 12 metropolitan areas with at least one million Latinos, including Los Angeles-Long Beach-Anaheim, CA; New York-NewarkJersey City, NY-NJ; Miami-Fort Lauderdale-Pompano Beach, FL; Houston-The Woodlands-Sugar Land, TX; Riverside-San Bernardino-Ontario, CA; Chicago-Naperville-Elgin, IL-IN; Dallas-Fort Worth-Arlington, TX; Phoenix-Mesa-Chandler, AZ; San Antonio-New Braunfels, TX; San Diego-Chula Vista-Carlsbad, CA; Washington-Arlington-Alexandria, DC-VA-MD-WV; and San Francisco-Oakland-Berkeley, CA. In 2020, Latinos were also residing in other nontraditional metropolitan destination areas outside of the Southwest such as Atlanta-Sandy SpringsAlpharetta, GA.
The influx of Latinos in new destination communities does not occur by chance. They are pulled by employment opportunities in those areas, such as working on fruit and vegetable farms, dairy farms, and meat processing industries in the rural Midwest and Southeast (Kandel & Parrado, 2005). Economic restructuring nationwide and globally and associated regulatory processes, including employment discrimination, layoffs, and community resistance, are primary factors that push Latino workers to migrate to different regions in the United States, including Michigan, in search of better opportunities. Other factors include lower housing costs and safer communities.
In Michigan and in the Midwest region in general, increased mechanization and consolidation of farms, loss of union and skilled agricultural jobs, decline in local small businesses, withdrawal of local state services (Sassen, 1990), and persistent poverty of rural communities contribute to the increased availability of a low-wage and unprotected jobs.
Dairy farms and new agricultural businesses, such as the meat processing industries, tend not to hire local residents. Instead, they actively recruit workers from other areas, including Latino, Asian, and African immigrants. Latino workers and their families have relocated to communities in Michigan and become permanent members.
The objectives of this article are twofold: 1) to describe the Latino population profiles in Michigan, including how the Latino population has changed over the past five decades, the age and sex composition, and the socioeconomic resource shares of Latinos; and 2) to highlight the spatial concentration of Latinos in Michigan by county.
Data and Methods
Data
Data were drawn from the 1980, 1990, 2000, 2010, and 2020 decennial censuses, the 2022 one-year American Community Survey, and U.S. Population Estimates by state, age, sex, race, and Hispanic origin. Data were retrieved from IPUMS-NHGIS (https://www.nhgis.org) or from the U.S. Census Bureau (www.census.gov).
Analytic Strategy
First, the analysis provides a description of the population size by race/ethnicity, highlighting the share of the Latino population in Michigan. Second, the analysis describes the Latino population growth and the change in its share from 1980 to 2022. Third, there is an analysis of the age and sex composition of Latinos as compared to that of non-Latino whites. The final analysis focuses on the spatial concentration of Latinos in Michigan by county. The analyses are purely descriptive (percentages, median, charts, and a map), focusing on Latino characteristics in Michigan.
Findings
Population Size by Race/Ethnicity, 2020
According to the 2020 Census, the U.S. population was 331.4 billion as of April 1, 2020. The Latino population was 62.1 million, representing 18.7% of the total population. In Michigan, the total population in 2020 was 10.1 million, and the Latino population was 564,422, representing 5.6% of the total population (Table 1). The non-Latino white population in 2020 was 191.7 million (57.8%) in the U.S. and 7.3 million (72.4%) in Michigan. The African American population in 2020 was 39.9 million (12.1%) in the U.S. and 1.4 million (13.5%) in Michigan. The Asian population, including Native Hawaiians and other Pacific Islanders, was 20.2 million (6.1%) in the U.S. and 334,891 (3.3%) in Michigan. The American Indian or Alaska Native count was 2.3 million (0.7%) in the U.S. and 47,406 (0.5%) in Michigan (Table 1).
Population Size by Latino Specific Origin, 2022
As of 2022, there were 572,405 Latinos living in Michigan. As Table 2 shows, this population constitutes 5.7 percent of the total population in Michigan. Latinos are not a monolithic group. In 2022, 67.6 percent of Latinos in Michigan were of Mexican origin; 8.9 percent were from Puerto Rico; 3.3 percent from Cuba; 0.9 percent from the Dominican Republic; 6.0 percent from Central America; 4.8 percent from South America; and 8.4 percent were other Latinos including Spaniards (Table 2).
| Ethnicity/Race | United States | % | Michigan | % |
|---|---|---|---|---|
| Total | 331,449,281 | 100.0 | 10,077,331 | 100.0 |
| Latino | 62,080,044 | 18.7 | 564,422 | 5.6 |
| Not-Latino white | 191,697,647 | 57.8 | 7,295,651 | 72.4 |
| Not-Latino Black or African American | 39,940,338 | 12.1 | 1,358,458 | 13.5 |
| Not-Latino American Indian and Alaska Native | 2,251,699 | 0.7 | 47,406 | 0.5 |
| Not-Latino Asian | 19,618,719 | 5.9 | 332,288 | 3.3 |
| Not-Latino Native Hawaiian and other Pacific Islander | 622,018 | 0.2 | 2,603 | 0.0 |
| Not-Latino some other race | 191,697,647 | 57.8 | 7,295,651 | 72.4 |
| Two or more races | 191,697,647 | 57.8 | 7,295,651 | 72.4 |
| Specific Origin | Total Population | % of Total Population | % of Latino Population |
|---|---|---|---|
| Total Population | 10,034,118 | -- | -- |
| Latinos | 572,405 | 5.7 | -- |
| Mexican | 386,713 | 3.9 | 67.6 |
| Puerto Rican | 51,116 | 0.5 | 8.9 |
| Cuban | 19,170 | 0.2 | 3.3 |
| Dominican | 5,430 | 0.1 | 0.9 |
| Central American | 34,554 | 0.3 | 6.0 |
| South American | 27,424 | 0.3 | 4.8 |
| Other Spanish/Hispanic/Latino | 47,998 | 0.5 | 8.4 |
Michigan Latino Population Change, 1980 to 2022
The Michigan Latino population has increased steadily over the past five decades, from 157,626 in 1980 to 573,514 people in 2022 (Figure 1). As a share of the Michigan population, Latinos continuously increased from 1.7% in 1980 to 5.7% in 2022 (Figure 2). Another way to look at it is to compare the Latino population change in each decade. The Michigan Latino population change was 27.8% between 1980 and 1990, 60.7% between 1990 and 2000, 34.7% between 2000 and 2010, and 29.3% between 2010 and 2020 (Figure 3).
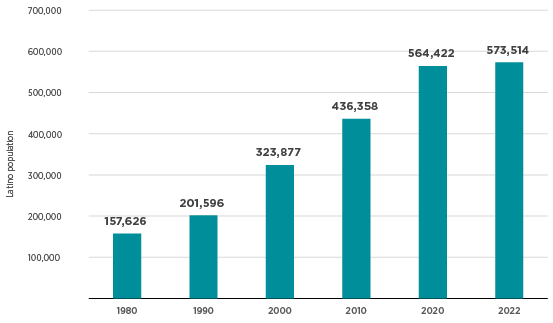
Figure 1. Michigan Latino Population Change, 1980 to 2022
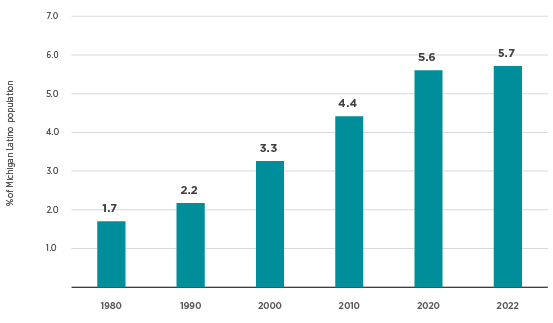
Figure 2. Percent of Michigan Latino Population, 1980 to 2020
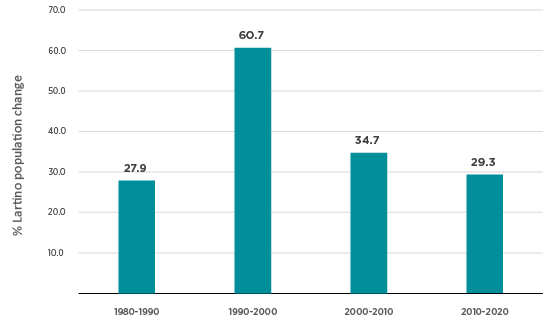
Figure 3. Percentage of Michigan Latino Population Change in the Last Four Decades
Michigan Population Change by Race/Ethnicity, 2010 to 2020
This section focuses only on the population change by race/ ethnicity in the last decade (2010 – 2020). Michigan’s population change in the last decade is mostly attributable to, on one hand, the growth of Latino and Asian populations and, on the other hand, the decline of the non-Hispanic white, Black, and American Indian/Alaska Native populations. The Latino population in Michigan grew from 436,358 people in 2010 to 564,222 in 2020, or a gain of 29.3%. The Latino percentage share of U.S. population growth was 66.1%. The Asian population, excluding Native Hawaiians and Pacific Islanders, grew from 236,490 in 2010 to 332,288 in 2020, an increase of 40.5%. The Asian percentage share of the Michigan population growth was 49.5%. In contrast, the non-Latino white population decreased from 7.6 million in 2010 to 7.3 million in 2020, a decline of 3.6%. The non-Latino white population share of the Michigan population change was -141.6%. The African American population decreased from 1,383,756 in 2010 to 1,358,458, a decline of 1.8%. The Native American or Alaska Native population declined from 54,665 in 2010 to 47,406, a decrease of 13.3% (Table 3).
| 2010 | 2020 | Change | |||||
| Number | % | Number | % | Number | % | %Share | |
| Total | 9,883,640 | 100.0 | 10,077,331 | 100.0 | 193,691 | 2.0 | 100.0 |
| Hispanic or Latino | 436,358 | 4.4 | 564,422 | 5.6 | 128,064 | 29.3 | 66.1 |
| Not-Hispanic White | 7,569,939 | 76.6 | 7,295,651 | 72.4 | -274,288 | -3.6 | -141.6 |
| Not-Hispanic Black or African American | 1,383,756 | 14.0 | 1,358,458 | 13.5 | -25,298 | -1.8 | -13.1 |
| Not-Hispanic American Indian and Alaska Native | 54,665 | 0.6 | 47,406 | 0.5 | -7,259 | -13.3 | -3.7 |
| Not-Hispanic Asian | 236,490 | 2.4 | 332,288 | 3.3 | 95,798 | 40.5 | 49.5 |
| Not-Hispanic Native Hawaiian and other Pacific Islander | 2,170 | 0.0 | 2,603 | 0.0 | 433 | 20.0 | 0.2 |
| Not-Hispanic some other race | 9,866 | 0.1 | 37,183 | 0.4 | 27,317 | 276.9 | 14.1 |
| Two or more races | 190,396 | 1.9 | 439,320 | 4.4 | 248,924 | 130.7 | 128.5 |
Age and Sex Composition
The Latino population in Michigan is younger than the non-Latino white population. In 2022, 32.5 percent of the Latino population in Michigan was under 18 years of age, compared to 18.4 percent of the non-Latino white population. Few Latinos were 65 years of age and older (6.4%) compared to non-Latino whites (21.6%) (Figure 4).
Table 4 displays the median age by sex, race, and ethnicity in 2020 in Michigan. The median age in 2020 for Latinos was 29.8 years (29.3 years for males and 30.3 years for females), compared to the median age for non-Latino whites of 43.7 years (42.3 years for males and 45.3 years for females) (Table 4).
|
|
Both sexes |
Male |
Female |
|---|---|---|---|
| Latinos or Hispanics |
29.8 |
29.3 |
30.3 |
| Non-Hispanic white |
43.7 |
42.3 |
45.3 |
The age and sex distributions for the Latino and non-Latino white populations for 2022 in Michigan are displayed in population pyramids (Figure 5). The shapes of the pyramids indicate a much younger Latino population compared to the non-Latino white population. The Latino population pyramid shows larger proportions at younger ages and progressively smaller proportions at older ages. The wider base of the pyramid reflects relatively high proportions of the young Latino population. In contrast, the non-Latino white pyramid is more rectangular, indicating an older population. The base of the non-Latino pyramid is narrower, reflecting relatively few young people. The non-Latino white pyramid also reveals a larger proportion of older age groups.
| Total | Poverty | Percent | |
|---|---|---|---|
| All | 9,828,430 | 1,315,899 | 13.4 |
| Latino | 558,250 | 101,908 | 18.3 |
| Non-Latino white | 7,165,227 | 756,468 | 10.6 |
Socioeconomic Resource Shares
Poverty Levels
As displayed in Table 5, the poverty rate in Michigan was estimated at 13.4 percent. The Latino poverty rate (18.3%) was significantly higher than that of non-Latino whites (10.6%) (Table 5).
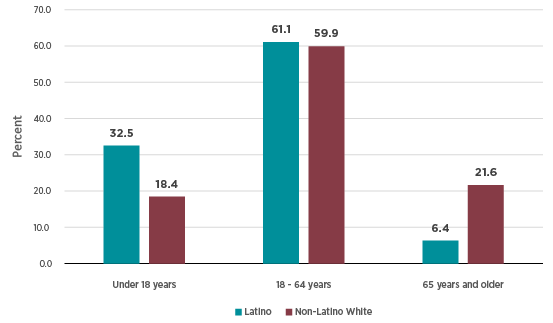
Figure 4. Michigan Latino and Non-Latino White Population by Age Groups, 2022
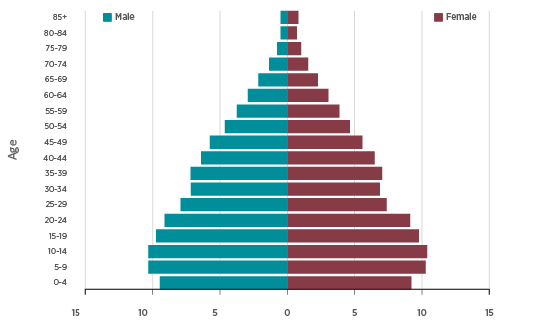
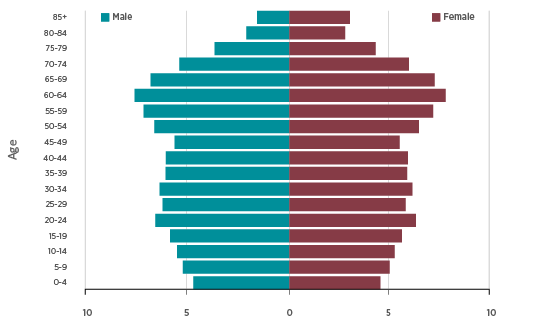
Figure 5. Michigan Latino and Non-Latino White Population Pyramids, 2022
Income
Table 6 displays the median household income by ethnicity/race. The median household income for Latinos ($62,497) was lower than that of non-Latino whites ($71,829). Latino median household income was about 7 percent times lower than non-Latino white median household income (Table 6).
| Median Household Income ($) | |
| All households | 66,986 |
| Latino | 62,497 |
| Non-Latino white | 71,829 |
| The ratio of Latino to white | 0.93 |
Educational Attainment
Table 7 displays the educational attainment of Latinos compared to that of non-Latino whites in Michigan. For both males and females, the levels of education attained by Latinos were below those of non-Latino whites. The educational attainment of Latinos at high school or lower levels was higher than that of non-Latino whites. In contrast, the educational attainment of Latinos at both some college and college or higher levels was lower than that of non-Latino whites (Table 7).
| Latino | Non-Latino White | |||||
| Education | All | Male | Female | All | Male | Female |
| Less than high school | 22.6 | 23.8 | 21.4 | 6.4 | 7.0 | 5.9 |
| High school or GED | 29.0 | 31.1 | 26.7 | 28.2 | 28.9 | 27.4 |
| Some college | 25.0 | 23.6 | 26.4 | 31.8 | 31.3 | 32.3 |
| College or more | 23.4 | 21.5 | 25.5 | 33.6 | 32.8 | 34.3 |
Employment
Table 8 displays the percent of the population 16 years and older who are in the labor force and the percent of the civilian labor force that is employed and unemployed by ethnicity/race. In 2022, about 62 percent of the population 16 years and older in Michigan were in the labor force. The unemployment rate was estimated at 4.6 percent. Although Latino civilians had higher labor force participation than non-Latino whites, they had nonetheless higher unemployment rates than non-Latino whites (Table 8).
| Ethnicity/race | % in the Labor Force | % Employed | % Unemployed |
|---|---|---|---|
| All | 61.6 | 95.4 | 4.6 |
| Latino | 70.0 | 93.9 | 6.1 |
| Non-Latino white | 60.9 | 96.5 | 3.5 |
Occupation
Table 9 displays occupational distributions by ethnicity/race. There were relatively more persons in the non-Latino white population (42.3%) in managerial and professional occupations, whereas 30.6 percent of Latinos work in these jobs. There were also more non-Latino whites working in sales and office (19.7%) than Latinos working in those jobs (17.1%). In contrast, there were more Latinos working in service (18.6%), natural resources, construction, and maintenance (11.1%), and production, transportation, and moving (22.5%) occupations than non-Latino whites working in service (14.6%), natural resources, construction, and maintenance (8.6%), and production, transportation, and moving (14.8%) occupations, respectively (Table 9).
| Latino | Non-Latino White | |||
| Occupation | Number | Percent | Number | Percent |
| Management, business, science, and arts | 81,573 | 30.6 | 1,518,568 | 42.3 |
| Service | 49,706 | 18.6 | 522,912 | 14.6 |
| Sales and office | 45,695 | 17.1 | 706,497 | 19.7 |
| Natural resources, construction, and maintenance | 29,725 | 11.1 | 307,440 | 8.6 |
| Production, transportation, and material moving | 60,112 | 22.5 | 530,761 | 14.8 |
| Total | 266,811 | 100.0 | 3,586,178 | 100.0 |
| All | Latino | Non-Latino White | ||||
| Housing tenure | Estimate | Percent | Estimate | Percent | Estimate | Percent |
| Total housing | 4,089,794 | 100.0 | 168,471 | 100.0 | 3,124,790 | 100.0 |
| Owner occupied | 2,991,685 | 73.2 | 99,784 | 59.2 | 2,478,577 | 79.3 |
| Renter occupied | 1,098,109 | 26.8 | 68,687 | 40.8 | 646,213 | 20.7 |
Housing Tenure
Table 10 displays housing tenure overall in Michigan and that of Latino and non-Latino white householders. About 73 percent of housing was owner-occupied. Latino householders had lower housing ownership (59.2%) than non-Latino white householders (Table 10).
The Spatial Distribution of Latino Population in Michigan by County, 2020
Figure 6 shows a map of Michigan that displays the total Latino population by county in 2020. The map displays the concentration of Latinos in each county in Michigan. The largest concentration of Latinos was in Wayne County (117,649). Other counties, in order of the number of Latinos, include Kent (75,228), Oakland (60,838), Ottawa (29,382), Macomb (26,214), Ingham (24,422), Washtenaw (20,731), Saginaw (16,904), Genesee (16,259), and Kalamazoo (14,776) (Table 11). Table 11 also shows the top ten counties with the highest proportions of Latinos in Michigan. The highest proportions of Latinos were, in order of the percentages, in Oceana, Van Buren, Kent, Ottawa, Lake, St. Joseph, Saginaw, Ingham, Lenawee, and Allegan counties, ranging from 15.4 percent to 7.8 percent (Table 11).
| County | Total Population | Rank | Latino Population | Percent Latino |
| Number | ||||
| Wayne | 1,793,561 | 1 | 117,649 | 6.56 |
| Kent | 657,974 | 2 | 75,228 | 11.43 |
| Oakland | 1,274,395 | 3 | 60,838 | 4.77 |
| Ottawa | 296,200 | 4 | 29,382 | 9.92 |
| Macomb | 881,217 | 5 | 26,214 | 2.97 |
| Ingham | 284,900 | 6 | 24,422 | 8.57 |
| Washtenaw | 372,258 | 7 | 20,731 | 5.57 |
| Saginaw | 190,124 | 8 | 16,904 | 8.89 |
| Genesee | 406,211 | 9 | 16,259 | 4.00 |
| Kalamazoo | 261,670 | 10 | 14,776 | 5.65 |
| Percent | ||||
| Oceana | 26,659 | 1 | 4,108 | 15.41 |
| Van Buren | 75,587 | 2 | 8,966 | 11.86 |
| Kent | 657,974 | 3 | 75,228 | 11.43 |
| Ottawa | 296,200 | 4 | 29,382 | 9.92 |
| Lake | 12,096 | 5 | 1,195 | 9.88 |
| St. Joseph | 60,939 | 6 | 5,427 | 8.91 |
| Saginaw | 190,124 | 7 | 16,904 | 8.89 |
| Ingham | 284,900 | 8 | 24,422 | 8.57 |
| Lenawee | 99,423 | 9 | 8,494 | 8.54 |
| Allegan | 120,502 | 10 | 9,389 | 7.79 |
Table 12 displays the top ten counties with the highest number and percentage of Latino population change between the 2010 and 2020 decennial censuses. The largest Latino population increase between 2010 – 2020 was in Wayne County, followed by Oakland, Kent, Macomb, Washtenaw, Ottawa, Kalamazoo, Ingham, Genesee, and Berrien counties. The highest percent change in Latino population between 2010 – 2020 was in Lake County, followed by Oscoda, Keweenaw, Marquette, Menominee, Delta, Kalaska, Missaukee, Dickinson, and Cheboygan counties (Table 12).
| County | Total Population | Rank | Latino Population | Percent Latino |
| Number | ||||
| Wayne | -27,023 | 1 | 22,389 | 23.50 |
| Oakland | 72,033 | 2 | 18,918 | 45.13 |
| Kent | 55,352 | 3 | 16,791 | 28.73 |
| Macomb | 40,239 | 4 | 7,119 | 37.28 |
| Washtenaw | 27,467 | 5 | 6,871 | 49.57 |
| Ottawa | 32,399 | 6 | 6,621 | 29.09 |
| Kalamazoo | 11,339 | 7 | 4,817 | 48.37 |
| Ingham | 4,005 | 8 | 3,896 | 18.98 |
| Genesee | -19,579 | 9 | 3,276 | 25.23 |
| Berrien | -2,497 | 10 | 2,156 | 30.56 |
| Percent | ||||
| Lake | 557 | 1 | 952 | 391.77 |
| Oscoda | -421 | 2 | 75 | 94.94 |
| Keweenaw | -110 | 3 | 12 | 80.00 |
| Marquette | -1,060 | 4 | 577 | 75.23 |
| Menominee | -527 | 5 | 208 | 74.82 |
| Delta | -166 | 6 | 225 | 70.75 |
| Kalkaska | 786 | 7 | 141 | 65.89 |
| Missaukee | 203 | 8 | 193 | 63.07 |
| Dickinson | -221 | 9 | 170 | 62.96 |
| Cheboygan | -573 | 10 | 130 | 61.61 |
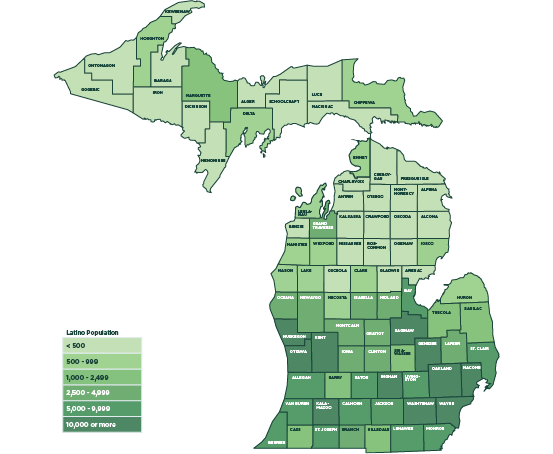
Figure 6. Map of the Latino Population in Michigan by County, 2020
Conclusion
The Latino population in the U.S. has been increasing. It increased significantly from 14.6 million in 1980 to 62.1 million in 2020, an increase of 325%. In 2020, Latinos represented 18.7% of the U.S. population, almost three times the Latino share of the U.S. population than in 1980 (6.4%). In Michigan, the Latino population was 564,222, or 5.6% of the total population in Michigan. The Latino population in Michigan increased from 157,626 in 1980 to 564,422 in 2020, an increase of 258%. In the last decade (2010-2020), 66 percent of the share of the Michigan population growth is attributable to the increase of Latinos. As a relatively young population, natural increase is a vital component of Latino population growth. The other is international migration. The Latino population in Michigan is diverse but predominantly comprised of Mexican-origin Latinos (about 68.8%), followed by Puerto Ricans (9.6%), Central Americans (4.7%), South Americans (4.2%), and Cubans (3.5%). Compared to non-Latino whites, Latinos are a much younger population. In 2020, 32.5% of the Latino population was younger than 18 years of age compared to 18.4% of non-Latino whites. Relatively few Latinos were age 65 and older (6.4%) compared to non-Latino whites (21.6%). The median age for Latinos was almost 30 years as compared to 44 years for non-Latino whites. The socioeconomic resource shares of Latinos in Michigan show that Latinos are disproportionately overrepresented in lower socioeconomic positions in Michigan, probably due to the history of economic, legal, educational, and political discrimination against Latinos. As compared to non-Latino whites, Latinos have higher poverty rates, lower median household income, lower housing ownership rates, lower educational attainment, and higher unemployment rates despite having higher labor force participation. They are also more likely to work in service; natural resources, construction, and maintenance; and production, transportation, and material moving occupations; and are less likely to work in managerial and professional occupations. Latinos are spatially concentrated in both metropolitan and nonmetropolitan areas, in counties such as Wayne (Detroit), Kent (Grand Rapids), Ottawa, Macomb, Ingham (Lansing), Washtenaw (Ann Arbor), Saginaw, Genesee (Flint), and Kalamazoo. They are also located in rural areas in counties such as Oceana, Van Buren, St. Joseph, Lenawee, and Allegan. They are attracted by employment opportunities in both metropolitan and nonmetropolitan counties in Michigan.
References
Frey, W. H. (2011). Melting pot suburbs. Brookings Institution, Washington, DC, USA.
Harrison, B., & Bluestone, B. (1987). Dark side of labour market “flexibility”: falling wages and growing income inequality in America (No. 992575113402676). International Labour Organization.
Kandel, W., & Parrado, E. A. (2005). Restructuring of the US meat processing industry and new Hispanic migrant destinations. Population and Development Review, 31(3), 447-471.
Kandel, W. A., & Parrado, E. A. (2006). Rural Hispanic population growth. In W. A. Kandel & D. L. Brown (eds), Population change and rural society (pp. 155-175). Springer, Dordrecht.
Parrado, E. A., & Kandel, W. A. (2010). Hispanic population growth and rural income inequality. Social Forces, 88(3), 1421-1450.
Sassen, S. (1990). Economic restructuring and the American city. Annual review of sociology, 16(1), 465-490.