Lansing Demographic and Socioeconomic Profiles
.jpg)
Introduction
Data from population censuses of 2010 and 2020 reveal a 2% increase in the total population in Michigan. This is most attributable to, on one hand, the growth of the Latino and Asian populations and, on the other hand, the decline of non-Latino white, African American, and American Indian and Alaska native populations. Between 2010 and 2020, the Latino population in Michigan grew by 29.3% and the Asian population by 40.5%. The percentage share of Michigan population growth was 66.1% for Latinos and 49.5% for Asians. In contrast, the non-Latino white population decreased by 3.6%, the African American population by 1.8%, and the American Indian or Alaska Native population by 13.3% (Kayitsinga, NEXO, Fall 2023).
Population change is unevenly distributed across Michigan and varies by race/ethnicity. The city of Lansing, like other communities in Michigan, experienced an influx of Latinos and, to a lesser extent, Asians. At the same time, Lansing experienced an out-migration of non-Latino whites and, to a lesser extent, African Americans to surrounding communities in the suburbs, elsewhere in Michigan, or out of state. These demographic changes alter the population profile of the city of Lansing in ways that require new thinking about public demands, policies, and investments for city and community development.
The influx of Latino and Asian populations to cities or communities like Lansing does not occur by chance. They are pulled by employment or business opportunities in those areas. Economic restructuring nationwide and globally and associated regulatory processes, including employment discrimination and layoffs, as well as political instability, violence, and conflicts, are primary factors that push Latino, Asian, and other migrant populations to move to different regions in the United States, including Michigan, in search of better opportunities. Other attractive factors include lower housing costs and safer communities.
In Michigan and the Midwest, economic restructuring has been associated with the loss of union and good skilled jobs, especially in manufacturing industries; the closing or relocation of manufacturing industries; a decline of local small businesses, state revenues, and services; and associated persistent poverty in cities such as Lansing and Detroit. These factors have contributed to increased availability of low-wage and unprotected jobs, especially in the service sectors, and lack of economic opportunities that may have triggered out-migration of native non-Latino white and African American populations who can move out of their impoverished communities. In addition, residential segregation and continued uneven development in many cities in Michigan have resulted in the concentration and persistence of poverty. Racial/ethnic minorities and female-headed families with children are further disadvantaged because they tend to cluster in disadvantaged neighborhoods with few economic opportunities, and Lansing is no exception.
This article focuses on the city of Lansing and the surrounding metropolitan area, which is composed of Clinton, Eaton, Ingham, and Shiawassee counties. Lansing is the capital of Michigan and a hub of both government administration offices and economic activities, including manufacturing industries, health, education, and hospitality services. This article addresses the following research questions:
1. How do demographic profiles and socioeconomic resource shares of Latinos, Blacks, Asians, and Native Americans compare across the city of Lansing and surrounding areas, as well as to non-Latino whites in these areas?
2. How do socioeconomic resource shares of Latinos, Blacks, Asians, and Native Americans compare across the city of Lansing, as well as to non-Latino whites in these areas?
3. What are the key dimensions of neighborhood social inequality in Lansing and surrounding areas?
First, this article describes the demographic characteristics of the Lansing metropolitan area. Second, this article focuses on the demographic characteristics and socioeconomic resource shares of the city of Lansing. Third, this article highlights social inequalities by race/ethnicity and by neighborhood in Lansing.
Data and Methods
Data
Data were drawn from the 1980, 1990, 2000, 2010, and 2020 decennial censuses, the 2022 one-year American Community Survey (ACS), Annual Population Estimates from April 1, 2020, to July 1, 2023, and 5-year 2018–2022 ACS Summary Files. Data were retrieved either directly from the U.S. Census (https://data.census.gov/advanced) or from IPUMS-NHGIS (https://www.nhgis.org).
Analytic Strategy
First, the analysis provides a description of the population size by race/ethnicity by county and total population change between 2020 and 2023 for the Lansing metropolitan area. Second, the analysis focuses on the city of Lansing, describing its demographic characteristics and socioeconomic shares. The final analysis details neighborhood demographic composition, focusing on Latino, African American, and non-Latino white populations, and concentrated poverty in Lansing.
Findings
Demographics and Population Change of the Lansing Metropolitan Area
Total Population by Race/Ethnicity, 2020
According to the 2020 Census, the total population of the Lansing metropolitan area was 541,297. In 2020, the racial/ethnic composition of the Lansing metropolitan area was as follows: 36,913 Latinos (6.8%), 408,905 non-Latino whites (75.5%), 43,868 African Americans (8.1%), 21,191 Asians, including Native Hawaiians and other Pacific Islanders (3.9%), and 1,717 American Indian or Alaska Natives (0.3%). Those who indicated on the census form that they were of other races or have two or more races numbered 38,703 (5.3%) (Figure 1).
The racial/ethnic composition of the Lansing metropolitan area differs significantly by county. As of July 1, 2022, 8.3% of the population in Ingham County were Latinos, 11.8% African Americans, 6.6 % Asians, and 68.8% non-Latino whites. In Eaton County, 6.1% of the population were Latinos, 7% African Americans, 2.5% Asians, and 81.5% non-Latino whites. In Clinton County, 5% of the total population were Latinos, 1.9% African Americans, 1.8% Asians, and 88.9% non-Latino whites. Shiawassee County is predominantly populated by non-Hispanic whites (93.6%). About 3.2% of the population were Latinos, followed by African Americans, Native Americans, and Asians at less than 1% each (Table 1). Figure 2 displays the racial/ethnic composition of counties in the Lansing metropolitan area.
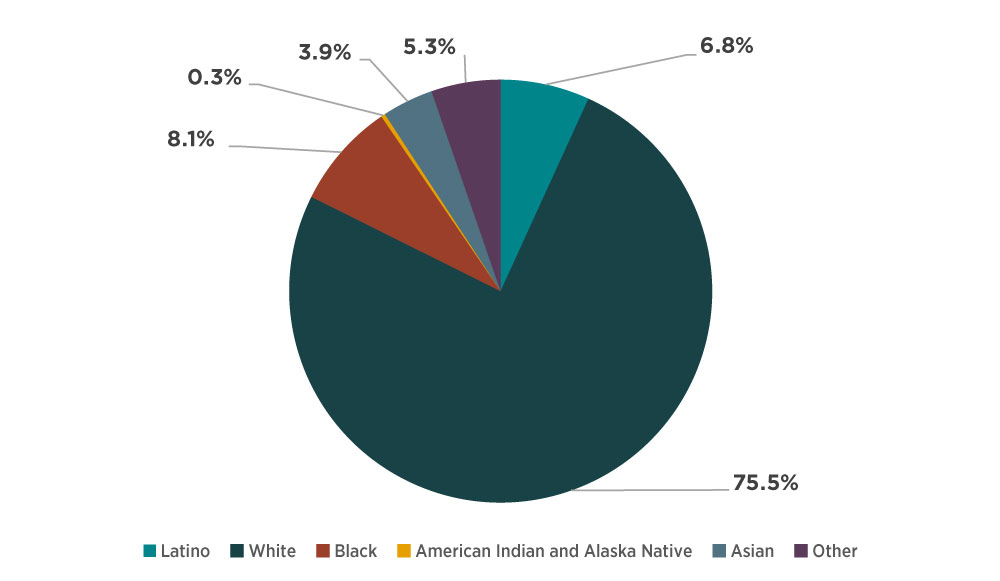
Figure 1. Total Population by Race/Ethnicity
| County | Total Population | Latino | Non-Latino White | African American | American Indian or Alaska Native | Asian | Other |
|---|---|---|---|---|---|---|---|
| Lansing region | 540,870 | 6.75 | 77.47 | 7.97 | 0.41 | 4.29 | 3.12 |
| Clinton | 79,748 | 5.02 | 88.93 | 1.92 | 0.42 | 1.75 | 1.97 |
| Eaton | 108,992 | 6.10 | 81.51 | 6.98 | 0.38 | 2.46 | 2.56 |
| Ingham | 284,108 | 8.34 | 68.82 | 11.79 | 0.41 | 6.60 | 4.04 |
| Shiawassee | 68,022 | 3.17 | 93.64 | 0.68 | 0.45 | 0.54 | 1.51 |
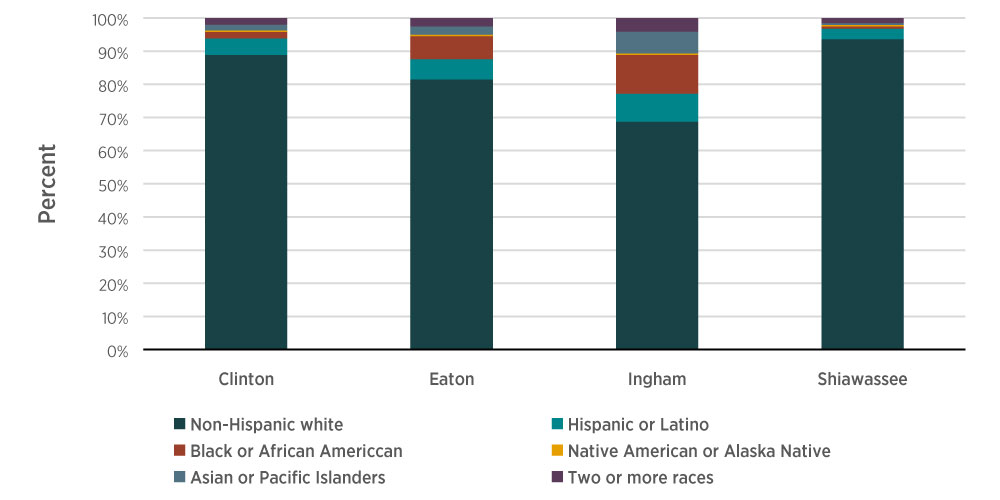
Figure 2. Percentages of Population Estimates by Race/Ethnicity by County, 2022
Population Change, 2020-2023
Table 2 displays total population change between 2020 and 2023. Overall, the total population in the Lansing metropolitan area did not change much, growing by just .03% between 2020 and 2023. The total population declined by 2.5% from 2020 to 2021, grew by 2.3% from 2021 to 2022, and grew again by .23% from 2022 to 2023. Most population change occurred in Ingham County, declining by 4.7% from 2020 to 2021, increasing by 4.5% from 2021 to 2022, and overall declining by 0.01% between 2020 and 2023. The following analysis focuses on the city of Lansing.
| Population (as of July 1) | Percent Change | |||||||
|---|---|---|---|---|---|---|---|---|
| County | 2020 | 2021 | 2022 | 2023 | 2020-2021 | 2021-2022 | 2022-2023 | 2020-2023 |
| Lansing region | 541,030 | 527,587 | 539,950 | 541,202 | -2.48 | 2.34 | 0.23 | 0.03 |
| Clinton | 79,170 | 79,464 | 79,652 | 79,720 | 0.37 | 0.24 | 0.09 | 0.69 |
| Eaton | 109,175 | 108,908 | 108,854 | 108,820 | -0.24 | -0.05 | -0.03 | -0.33 |
| Ingham | 284,675 | 271,224 | 283,477 | 284,637 | -4.73 | 4.52 | 0.41 | -0.01 |
| Shiawassee | 68,010 | 67,991 | 67,967 | 68,025 | -0.03 | -0.04 | 0.09 | 0.02 |
Demographics and Socioeconomic Shares of Lansing City
Population Size and Change of Lansing City
Figure 3 displays the city of Lansing population by race/ethnicity. As of April 1, 2020, Lansing’s population was 112,644. The population was composed of 13.7% Latinos, 22.5% African Americans, 4.2% Asians, and 51.3% non-Latino whites.
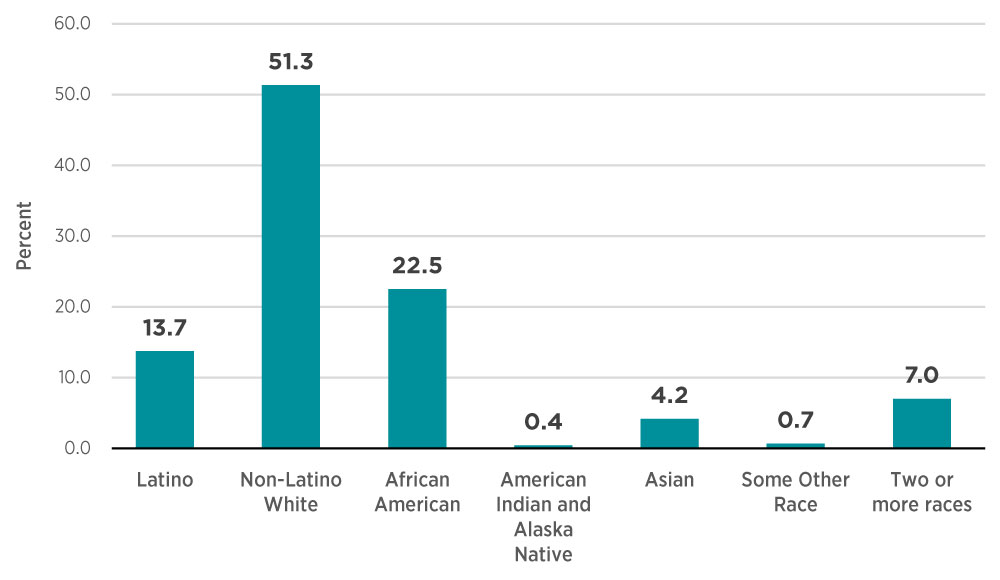
Figure 3. Population by Race/Ethnicity, 2020
Figure 4 displays Lansing population change in the past 5 decades (1980– 2020). The city’s total population continuously declined, from 130,414 in 1980 to 112,644 in 2020, a decrease of 17,770 people or 13.6% (Figure 4).
Table 3 displays Lansing population change in the past decade (2010– 2020). The Lansing total population declined by 1,653 people, or 1.5% between 2010 and 2020. Like the overall population shift in Michigan, the change in the Lansing population is mostly attributable to the growth of Latino and Asian populations and to the decline of non-Latino white, African American, and American Indian and Alaska Native populations.
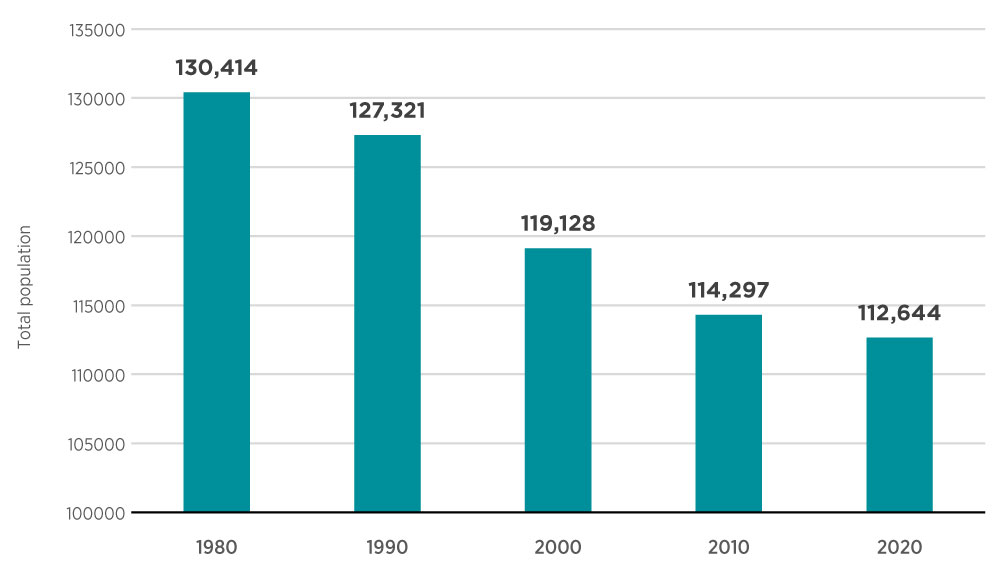
Figure 4. Population Change, 1980-2020
The Latino population in Lansing grew from 14,292 in 2010 to 15,467 in 2020, a gain of 8.2%. The Latino percentage share of the Lansing population growth was 71.1%. The Asian population in Lansing grew from 4,240 in 2010 to 4,764 in 2020, or 12.4%. The Asian percentage share of the Lansing population growth was 31.7%. In contrast, the non-Latino white population in Lansing decreased from 63,381 in 2010 to 57,838 in 2020, an 8.8% decline. The African American population in Lansing decreased from 26,194 in 2010 to 25,376 in 2020, a 3.1% decline. The Native American or Alaska Native population decreased from 681 in 2010 to 504 in 2020, a 26% decline.
| 2010 | 2020 | Change | |||||
| Number | % | Number | % | Number | % | %Share | |
| Total Population | 114,297 | 100.00 | 112,644 | 100.00 | -1,653 | -1.45 | 100.0 |
| Hispanic or Latino | 14,292 | 12.50 | 15,467 | 13.73 | 1,175 | 8.22 | 71.08 |
| Non-Hispanic White | 63,381 | 55.45 | 57,838 | 51.35 | -5,543 | -8.75 | -335.33 |
| Black or African American | 26,194 | 22.92 | 25,376 | 22.53 | -818 | -3.12 | -49.49 |
| American Indian and Alaska Native | 681 | 0.60 | 504 | 0.45 | -177 | -25.99 | -10.71 |
| Asian and Native Hawaiian and other Pacific Islander | 4,240 | 3.71 | 4,764 | 4.23 | 524 | 12.36 | 31.70 |
| Some Other Race alone | 214 | 0.19 | 767 | 0.68 | 553 | 258.41 | 33.45 |
| Two or More Races | 5,295 | 4.63 | 7,928 | 7.04 | 2,633 | 49.73 | 159.29 |
Age and Sex Composition
Table 4 displays Lansing city population by age group, sex, and race/ ethnicity in 2022. About 21.4% of the Lansing population were under 18 years of age whereas 13.4% were 65 years or older. The childelderly ratio was about 1:6. The median age was estimated at 33.9 years (33 for males and 34.5 for females). In 2022, 22.1% of African Americans, 18.1% of Latinos, 22% of Asians, and 28.9% of American Indian and Alaska Natives in Lansing were under 18 years of age, compared to 16.5% of the non-Hispanic white population. About 13.1% of African Americans, 12.6% of Latinos, 5.1% of Asians, and 19.3% of American Indians and Alaska natives were 65 or older compared to about 16.8% of the non-Hispanic white population in Lansing. Table 4 also displays the median age by race/ethnicity in 2022 in Lansing. The median age in 2022 was 31 years for Latinos, 37 for African Americans and non-Latino whites, and 27 for Asians.
The age-sex distribution for Lansing’s total population in 2022 is displayed in the population pyramid in Figure 5. The pyramid is more rectangular, indicating both an older population, but also a younger population.
| Pct. < 18 years | Pct. 65+ | Child-elderly ratio | Median age | |
| Total | 21.4 | 13.4 | 1.60 | 33.9 |
| Sex | ||||
| Male | 21.0 | 11.8 | 1.78 | 33.0 |
| Female | 21.8 | 14.9 | 1.46 | 34.5 |
| Race/Ethnicity | ||||
| Non-Hispanic white | 16.5 | 16.8 | 0.98 | 36.6 |
| Non-Hispanic black | 22.1 | 13.1 | 1.69 | 37.2 |
| Hispanic or Latino | 18.1 | 12.6 | 1.44 | 30.9 |
| Asian | 22.0 | 5.1 | 4.31 | 27.2 |
| American Indian and Alaska Native | 28.9 | 19.3 | 1.49 | -- |
| Some Other Race alone | 25.2 | 11.5 | 2.19 | 31.1 |
| Two or More Races | 34.0 | 5.3 | 6.45 | 24.0 |
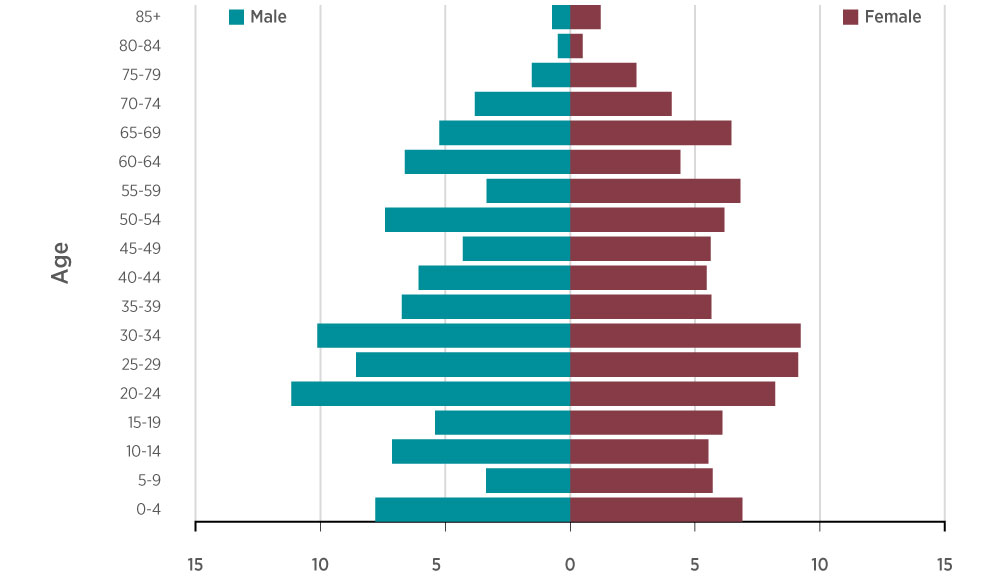
Figure 5 - Total Population by Age and Sex
Socioeconomic Status
Figure 6 displays the educational attainment of people 25 years and older in the city of Lansing. About 30% of Lansing residents 25 years and older had at least a bachelor’s degree, 25% had some college but no degree, 10% had an associate degree, 25% had a high school diploma or equivalent, and 11% had less than a high school education (Figure 6).
As expected, educational attainment for the population 25 years and older in Lansing varies by race/ethnicity. Figure 7 displays the results. Latinos are more likely to have a high school diploma or equivalent and less likely to have a college degree or greater than non-Latino whites. African Americans are more likely to have some college than non-Latino whites. Non-Latino whites are more likely to have a college degree or higher than Latinos or African Americans.
Poverty Level
As displayed in Table 5, the poverty rate in Lansing city was estimated at 22.2%. The family poverty rate was estimated at 17.2% and, as expected, female-headed families with children under 18 had the highest poverty rates (53.4%). As expected, the personal poverty rate was highest among African Americans (27.0%), Latinos (20.5%), and non-Latino whites (15.7%). The family poverty rate also varied by race/ethnicity.
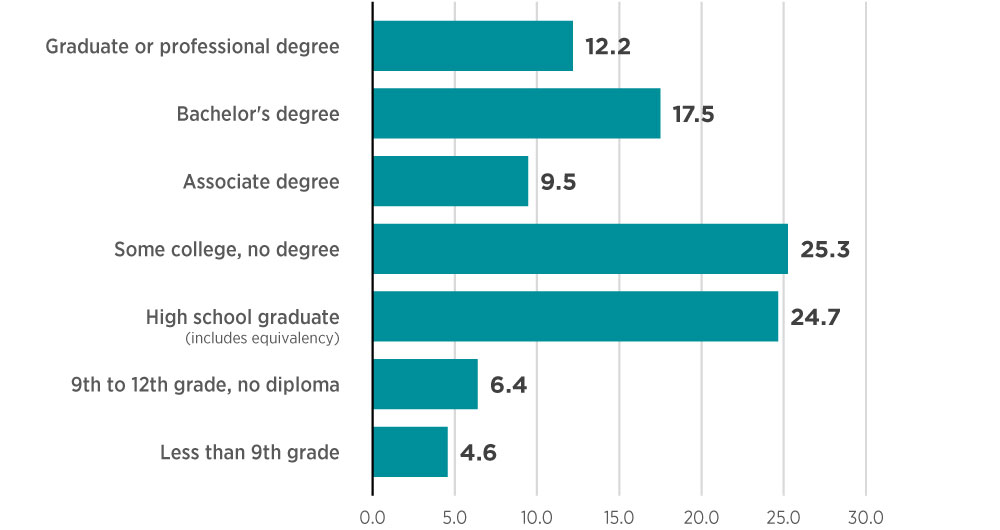
Figure 6. Educational Attainment of Population 25 Years and Older, 2022
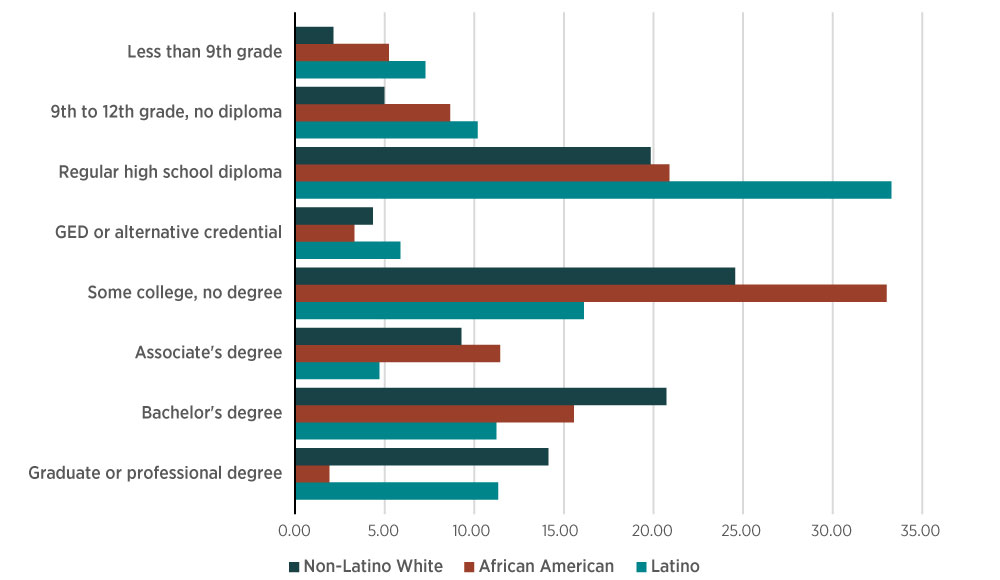
Figure 7. Educational Attainment of Population 25 Years and Older by Race/Ethnicity, 2022
The family poverty rate was 23.5% for African American families, 18.3% for Latino families, and 11.1% for non-Latino white families, respectively. African American and Latino families with children under 18 years, especially female-headed families with children under 18, were more likely to be in poverty than their non-Latino white counterparts. The family poverty rate was 37.6% for African American families with children under 18, 31.1% for Latino families with children under 18, and 17.9% for non-Latino white families with children under 18. For female-headed families with children under 18, the poverty rate was 54.1% for Latino families and 42.1% for African American families, compared to 31.0% for non-Latino white female-headed families with children under 18 years.
Household Income
Table 6 displays household income distribution and the median household income in the city of Lansing by race/ethnicity in 2022. The median household income was estimated at $48,962 (±$4,140). About 36% of Lansing residents had a household income of less than $35,000, 34% between $35,000 and $74,999, 14% between $75,000 and $99,999, and 17% $100,000 or higher (Table 6).
As expected, household income varies by race/ethnicity. The median household income for was $51,037 (±$17,830) for Latinos in the city of Lansing, $39,990 (±$24,652) for African Americans, and $50,267 (±$4,930) for non-Latino whites. Table 6 also reveals household income inequalities by race/ethnicity. About 48.5% of African American households had household income less than $35,000, compared to 28.5% of Latino households and 30.7% of non-Latino white households.
| Poverty level | Total | Latino | African American | Non-Latino White |
| All people | 22.2 | 20.5 | 27.0 | 15.7 |
| All families | 17.2 | 18.3 | 23.5 | 11.1 |
| With children under 18 years | 29.9 | 31.1 | 37.6 | 17.9 |
| Married couple families | 6.9 | 5.8 | 11.8 | 5.8 |
| With children under 18 years | 11.4 | 6.3 | 24.9 | 12.0 |
| Female-headed, no spouse | 37.6 | 30.2 | 32.4 | 26.7 |
| With children under 18 years | 53.4 | 54.1 | 42.1 | 31.0 |
| All | Latino | African American | Non-Latino White | |||||
| Household Income | N | % | N | % | N | % | N | % |
| Total households | 53,147 | 100.0 | 5,764 | 100.0 | 11,571 | 100.0 | 30,311 | 100.0 |
| Less than $10,000 | 3,864 | 7.3 | 574 | 10.0 | 632 | 5.5 | 2166 | 7.1 |
| $10,000 to $14,999 | 3,440 | 6.5 | 290 | 5.0 | 1672 | 14.4 | 953 | 3.1 |
| $15,000 to $24,999 | 6,557 | 12.3 | 120 | 2.1 | 2340 | 20.2 | 3311 | 10.9 |
| $25,000 to $34,999 | 5,076 | 9.6 | 656 | 11.4 | 971 | 8.4 | 2903 | 9.6 |
| $35,000 to $49,999 | 8,147 | 15.3 | 1118 | 19.4 | 616 | 5.3 | 5746 | 19.0 |
| $50,000 to $74,999 | 9,929 | 18.7 | 1311 | 22.7 | 2130 | 18.4 | 5421 | 17.9 |
| $75,000 to $99,999 | 7,368 | 13.9 | 710 | 12.3 | 2079 | 18.0 | 3821 | 12.6 |
| $100,000 to $149,999 | 5,530 | 10.4 | 578 | 10.0 | 976 | 8.4 | 3707 | 12.2 |
| $150,000 to $199,999 | 2277 | 4.3 | 142 | 2.5 | 79 | 0.7 | 1730 | 5.7 |
| $200,000 or more | 959 | 1.8 | 265 | 4.6 | 76 | 0.7 | 553 | 1.8 |
| Median household income (MOE) | $48,962 (± $4,140) | $51,037 (± $17,830) | $39,990 (± $24,652) | $50,267 (± $4,930) | ||||
In the middle class, 42.1% of Latino households, compared to 23.7% of African American households and 36.9% of non-Latino white households, had a household income of $35,000–$74,999. In the upper middle class, 12.3% of Latino households, 18% of African American households, and 12.6% of non-Latino white households had an income of $75,000–$99,999. In the upper class, 17.1% of Latino households, 9.8% of African American households, and 19.7% of non-Latino white households had an income of $100,000 or higher (Table 6).
Housing Tenure
Figure 8 displays housing tenure in the city of Lansing in 2022. About 56.4% of housing units in Lansing were owner-occupied and 43.6% were rented units. Figure 8 also displays racial/ethnic housing inequalities in Lansing. About 62.3% of African American housing units were rented and 37.7% were owner-occupied. About 43.5% of Latino housing units were rented and 56.5% were owner-occupied. In comparison, 36.1% of non-Latino white housing units were rented and 63.9% were owner-occupied.
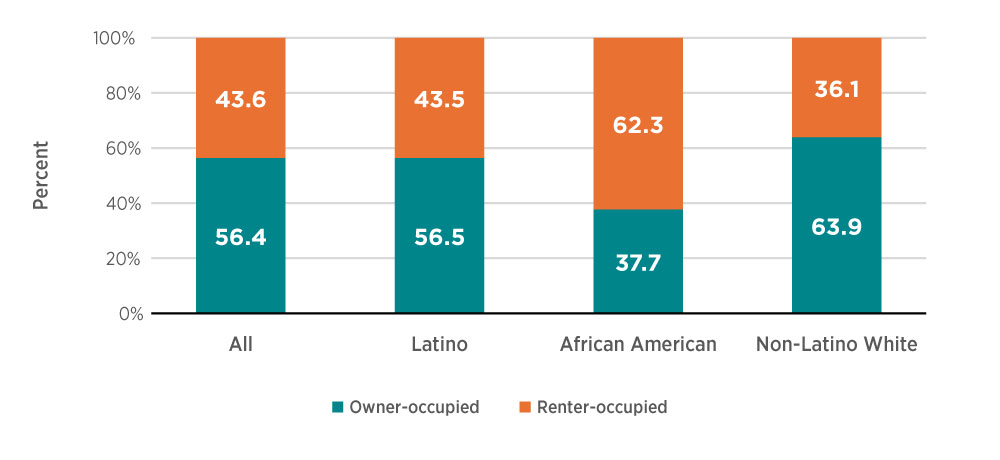
Figure 8. Housing Tenure by Race/Ethnicity, 2022
Health Insurance Coverage
Table 7 displays the health insurance coverage of Lansing residents in 2022. About 94% of residents had health insurance coverage and 6% of residents had no health insurance coverage. Health insurance coverage in Lansing varies by race/ethnicity. About 11% of Latinos and 8% of African Americans had no health insurance coverage compared to 5% of non-Latino whites.
| All | Latino | African American | Non-Latino White | |||||
| Health Insurance Coverage | Estimate | % | Estimate | % | Estimate | % | Estimate | % |
| Total Population | 112,829 | 100.0 | 12,510 | 100.0 | 24,754 | 100.0 | 58,497 | 100.0 |
| With health insurance coverage | 105,677 | 93.7 | 11,104 | 88.8 | 22,869 | 92.4 | 55,436 | 94.8 |
| No health insurance coverage | 7,152 | 6.3 | 1,406 | 11.2 | 1,885 | 7.6 | 3,061 | 5.2 |
Employment
Employment Status
Table 8 displays the percentage of the population 16 years and older in the city of Lansing in the labor force and the percentage of the civilian labor force that is employed and unemployed by race/ethnicity. In 2022, 69% of people 16 and older were in the labor force. About 64.4% of those 16 and older were employed. The unemployment rate in the city of Lansing was estimated at 6.4%.
| All | Latino | African American | Non-Latino White | |||||
| Estimate | % | Estimate | % | Estimate | % | Estimate | % | |
| Population 16 years and over | 91,757 | 100.0 | 10,808 | 100.0 | 19,977 | 100.0 | 51,227 | 100.0 |
| Civilian labor force | 63,140 | 68.8 | 7,355 | 68.1 | 13,154 | 65.8 | 34,207 | 66.8 |
| Employment rate | 59,075 | 64.4 | 6,477 | 59.9 | 11,251 | 56.3 | 31,969 | 62.4 |
| Unemployment rate* | 4,065 | 6.4 | 878 | 11.9 | 1,903 | 14.5 | 2,238 | 6.5 |
| Not in labor force | 28,617 | 31.2 | 3,433 | 31.8 | 6,823 | 34.2 | 17,008 | 33.2 |
Notes: *Percent of the civilian labor force.
About 68.1% of Latinos 16 years and older in the city of Lansing were in the civilian labor force. In comparison, 65.8% of African Americans and 66.8% of non-Latino whites 16 and older were in the civilian labor force. About 59.9% of Latinos 16 and older were employed. In comparison, about 56.3% of African Americans and 62.4% of nonLatino whites 16 and older were employed. The unemployment rate was highest for African Americans (14.5%), compared with that of Latinos (11.9%) and that of non-Latino whites (6.5%).
| All | Latino | African American | Non-Latino White | |||||
| Class of worker | Estimate | % | Estimate | % | Estimate | % | Estimate | % |
| Civilian employed Population 16 years and over | 59,075 | 100.0 | 6,477 | 100.0 | 11,251 | 100.0 | 31,969 | 100.0 |
| Private sector | 44,998 | 76.2 | 5,296 | 81.8 | 8,883 | 79.0 | 24,649 | 77.1 |
| Government workers | 11,969 | 20.3 | 1,006 | 15.5 | 2,034 | 18.1 | 5,897 | 18.4 |
| Self-employed | 2,034 | 3.4 | 158 | 2.4 | 334 | 3.0 | 1,411 | 4.4 |
| Unpaid family workers | 74 | 0.1 | 17 | 0.3 | 0 | 0.0 | 12 | 0.0 |
Class of Worker
Table 9 displays the distribution of the workforce in the city of Lansing by class of worker and race/ethnicity in 2022. About 76% of the workforce in Lansing were employed in the private sector, 20% in the public sector, and 3% were self-employed. About 82% of the Latino workforce were employed in the private sector, 16% in the public sector, and 2% were self-employed. About 79% of the African American workforce in Lansing were employed in the private sector, 18% in the public sector, and 3% were self-employed. Comparatively, about 77% of the non-Latino white workforce in Lansing were employed in the private sector, 18% in the public sector, and 4% were self-employed.
Industry
-by-Industry-of-Employment,-2022.jpg)
Figure 9. Percentage of Civilian Labor Force Employed (16 Years and Older) by Industry of Employment, 2022
-by-Industry-of-Employment-and-Race-and-Ethnicity,-2022.jpg)
Figure 10. Percentage of Civilian Labor Force Employed (16 Years and Older) by Industry of Employment and Race/Ethnicity, 2022
-by-Occupation,-2022.jpg)
Figure 11. Percent of Civilian Labor Force Employed (16 Years and Older) by Occupation, 2022
Figure 9 displays the percentage of the Lansing city population 16 years and older by the industry of employment in 2022. Educational services, health care, and social assistance are the top industries in the city of Lansing. They accounted for 26% of employment in Lansing in 2022. Retail trade, manufacturing, Arts, entertainment, recreation, accommodations, and food services, and professional, scientific, and management services are other large employers, each accounting for more than 10% of the employment in Lansing in 2022.
Figure 10 displays industry of employment by race/ethnicity in the city of Lansing in 2022. It is expected that the industry of employment would vary by race/ethnicity. African Americans are more likely to be employed in education, health care, and social assistance services and in transportation, warehousing, and utilities. Latinos are more likely to be employed in services, construction, and extractive industries. Non-Latino whites are more likely to be employed in professional, scientific, and management services, public administrative, finance, insurance, and real estate, and wholesale trade.
Figure 11 displays the percentage of the Lansing population 16 years and older by occupation in 2022. About 39% of the civilian labor force 16 and older were occupied in managerial and professional occupations, 20% in service occupations, 19% in sales and office occupations, 17% in production, transportation, and material moving occupations, and 6% in natural resources, construction, and maintenance occupations, respectively.
Occupation
Figure 12 displays the percentage of the Lansing population 16 years and older by occupation by race/ethnicity. Non-Latino whites were more likely to be employed in management, business, science, and arts occupations, and sales and office occupations than African Americans and Latinos. African Americans, followed by Latinos, were more likely to be employed in service occupations and production, transportation, and material moving occupations than non-Latino whites. Latinos were more likely to be employed in natural resources, construction, and maintenance occupations than African Americans and non-Latino whites (Figure 12).
-by-Occupation-by-Race-and-Ethnicity,-2022.jpg)
Figure 12. Percent of Civilian Labor Force Employed (16 Years and Older) by Occupation by Race/Ethnicity, 2022
Spatial Characteristics of the Lansing Regional Area
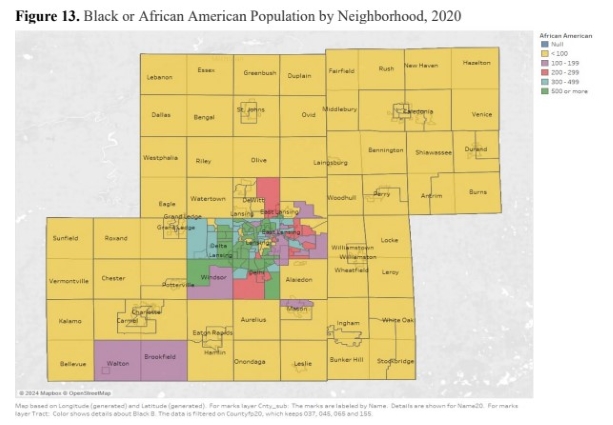
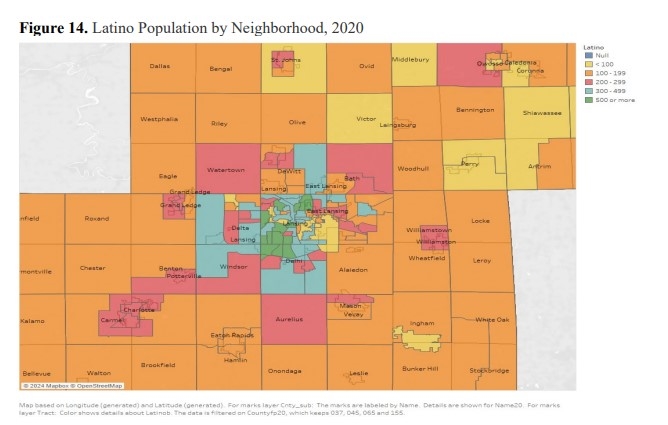
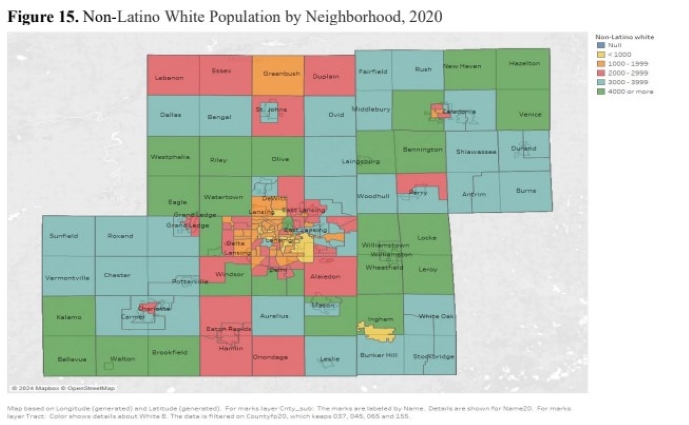
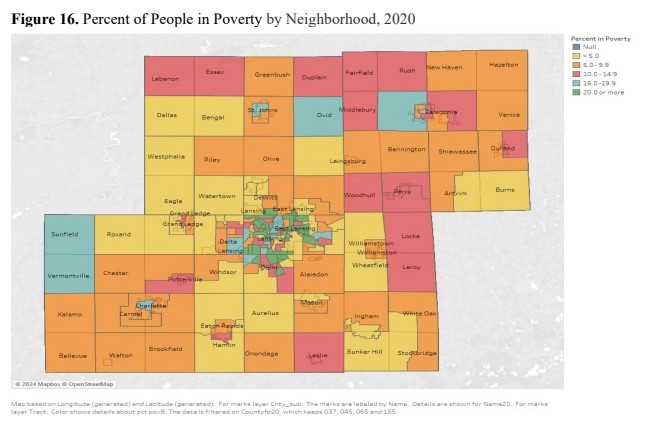
Figures 13–16 show maps of the Lansing regional area population by race/ethnicity and poverty concentration by neighborhood (census tract) in 2022. African American and Latino populations and the proportion of residents in poverty are concentrated in Lansing city neighborhoods whereas the non-Latino white populations are concentrated in the surrounding and peripheral neighborhoods of Lansing.
Conclusion
This article highlights the demographic profile of the Lansing metropolitan area and that of the city of Lansing. According to the 2020 decennial census, the population in the Lansing metropolitan area, which is composed of Ingham, Eaton, Clinton, and Shiawassee counties, was about 7% Latinos, 8% African Americans, 4% Asians, and almost 76% non-Latino whites. The racial/ethnic composition of the population in the Lansing metropolitan area differs by county. Minority populations are more concentrated in Ingham County than other counties. Overall, the total population in the Lansing metropolitan area has not changed much between 2020 and 2023. Most of the population change occurred in Ingham County.
Within the city of Lansing, the racial/ethnic composition was almost 14% Latinos, 23% African Americans, 4% Asians, and 51% non-Latino whites. Between 1980 and 2020, the Lansing city population has continuously declined each year. The population change in Lansing mirrors that of Michigan overall, both of which are mostly attributable to an increase in the Latino and Asian populations and a decrease in the non-Latino white, African American, and American Indian and Alaska Native populations.
The results also show that Lansing city population is very young. The median population is about 34 years (33 for males and 35 for females). African American, Latino, and Asian populations are more likely to be under 18 than the non-Latino white population. Non-Latino white and American Indian and Alaska Native populations in Lansing city are more likely to be 65 and older than African American, Latino, and Asian populations.
The socioeconomic shares in Lansing city reveal significant social inequalities in terms of educational attainment, poverty, household income, housing tenure, and access to health care. Almost 30% of Lansing residents 25 years and older have a college degree or higher, 35% have some college or an associate degree, 25% have a high school diploma or equivalent, and 11% have less than a high school education. However, educational attainment in the city of Lansing varies by race/ethnicity. Latinos are more likely to have a high school education or less and less likely to have a college degree or higher than non-Latino whites. African Americans are more likely to have some college with no degree or an associate degree than non-Latino whites. Non-Latino whites are more likely to have a college degree or higher than Latinos and African Americans.
Slightly more than one-fifth of the Lansing city population is in poverty. African Americans, followed by Latinos, are significantly more likely to be in poverty than non-Latino whites. At the family level, about 17% of families are in poverty, and poverty is highest among families with children under 18 years old, especially among female-headed families with children. More than half of female-headed families with children are in poverty.
In terms of household income, the median in the city of Lansing is estimated at $48,962. About 36% of households have household incomes below $35,000, 34% between $35,000 and $74,999, 14% between $75,000 and $99,999, and 17% $100,000 and above. African Americans have the lowest median household income. The median household income of Latinos is slightly higher than that of non-Latino whites. Almost half (48.5%) of African Americans have household incomes below $35,000. About 42% of Latinos have household incomes between $35,000 and $74,999. African American households are more likely to be in the upper middle class ($75,000–$99,999) than Latino and non-Latino white households. Non-Latino white households are more likely to be in the upper class ($100,000 or more) than Latino and African American households.
In terms of housing ownership in Lansing city, African Americans are less likely to own a home (38%) as compared to Latinos (56%) and nonLatino whites (64%). The results also show social inequalities in terms of health insurance coverage. About 6% of Lansing residents had no health insurance coverage. About 11% of Latinos, 8% of African Americans, and 5% of non-Latino whites had no health insurance coverage.
The article also highlights employment status, occupation, and industry of employment for the civilian labor force 16 years and older in the city of Lansing by race/ethnicity. In 2022, the unemployment rate was estimated at 6.4%. African Americans, followed by Latinos, were more likely to be unemployed than non-Latino whites. African Americans were more likely to be employed in education, health, and social assistance services and in transportation, warehousing, and utilities. Latinos were more likely to be employed in services, construction, and extractive industries. African Americans, followed by Latinos, were more likely to be employed in service, and production, transportation, and material moving occupations, than non-Latino whites. Latinos were more likely to be employed in natural resources, construction, and maintenance occupations than African Americans and non-Latino whites. Non-Latino whites were more likely to be employed in professional, scientific, and management services, public administrative, finance, insurance, and real estate, and wholesale trade. In terms of occupations, African Americans, followed by Latinos, were more likely to be employed in service, and production, transportation, and material moving occupations than non-Latino whites. Latinos were more likely to be employed in natural resources, construction, and maintenance occupations than African Americans and non-Latino whites. Non-Latino whites were more likely to be employed in management, business, science, arts, and in sales and office occupations, than African Americans and Latinos.
Finally, this article shows that African Americans and Latinos are spatially concentrated in neighborhoods within the city of Lansing, whereas non-Latino whites are concentrated in surrounding neighborhoods in the Lansing metropolitan area. The concentration of poverty, as an indicator of concentrated disadvantaged neighborhoods, is significantly higher in Lansing city neighborhoods than in surrounding neighborhoods in the Lansing metropolitan area.
In sum, the continuous decline of the Lansing city population resulted from a decline of non-Latino white, African American, and American Indian and Alaska Native populations, and it could have been worse if it were not for the growth of the Latino and Asian populations. These population changes alter the social fabric of local communities, the social, economic, and political profiles. African Americans and Latinos are the predominant minority populations in the city of Lansing and are generally younger and possess several economic disadvantages. They have relatively low levels of education, higher poverty rates, higher unemployment rates, lower household incomes, lower housing ownership rates, and lower health insurance coverage compared to non-Latino whites. They are also more likely to work in health, social assistance services and in transportation, warehousing, and utilities, services, construction, and extractive industries, and they are less likely to be employed in managerial and professional occupations.
These socioeconomic disadvantages reveal a mixed portrait of living conditions in the city of Lansing. City officials will have to address racial/ethnic socioeconomic inequalities by improving education for all, but especially for minority residents who are left behind in terms of human capital. Poverty alleviation programs are needed for African Americans, Latinos, and female-headed families with children who have the highest poverty rates as compared to other families. That will require creating more employment opportunities, but employment opportunities that offer improved living conditions, i.e., well-paying jobs. Working in low-paying and unstable jobs is less likely to offer living wages, residential stability, and financial capital necessary for home ownership. Improving income opportunities is crucial to improve the well-being of Lansing city residents.
