
The Social Context of Adult Obesity in the United States
.png)
Background
Obesity has become a common, serious, and costly health condition in the United States. According to the Centers for Disease Control and Prevention (CDC), the prevalence of obesity was 41.9 percent in 2017 – March 2020 (Stierman et al., 2021). U.S. obesity prevalence increased from 30.5 percent to 41.9 percent from 1999 – 2000 to 2017 – March 2020 (Stierman et al., 2021). The high prevalence of obesity constitutes a major public health concern as obesity increases the risk for developing chronic diseases such as diabetes, cardiovascular diseases, certain cancers, and other chronic conditions that cause disability and premature death. Obesity is also associated with increased costs for health care systems (Ward et al., 2021).
The causes of obesity are complex, multifaceted, and multilevel, ranging from genetic and biological predispositions, individual behaviors such as dietary intake and physical activity/inactivity, family social environments, neighborhood social, physical, and nutritional environments, and to more distal and systemic factors such as food systems and social and economic policies. Social structural factors, especially race/ethnicity, gender, and socioeconomic status (SES), remain the main causal factors of obesity (Hargrove, 2018; Liu & Guo, 2015; Mueller et al., 2010; Pudrovska et al., 2014; Schmeer, 2010).
The prevalence of obesity varies by race/ethnicity, gender, and SES, with Latinos, Blacks, women, especially Black women, and those from lower SES background exhibiting higher prevalence rates of obesity than their white, male, and higher SES counterparts (Clarke et al., 2009; Ogden et al., 2014; Wang and Beydoun, 2007; Ailshire and House, 2011; Flegal et al., 2012). The prevalence of obesity varies by income and education, but results are not consistent by gender, and race/ethnicity (Ogden et al., 2010). During 2011-2014, the age-adjusted prevalence of obesity among adults was lower in the highest income group (31.2%) (≥ 350% of the Federal Poverty level (FPL)) than in other groups (40.8%) for >130% to ≤ 350% FPL and 39.0% for ≤ 130% FPL.
The age-adjusted prevalence of obesity among college graduates was lower (27.8%) than among those with some college (40.6%) and those who were high school graduates or less (40.0%) (Ogden et al., 2017).
These patterns are consistent with two complementary theories: the life course theory and the fundamental cause theory. From a life course perspective using a cumulative advantage/disadvantage approach, SES and other disadvantages originating in childhood accumulate over the life course to produce obesity (or other health problems and early mortality). Conversely, SES and other advantages over a person’s life course accumulate but do so to avoid obesity. The accumulation of disadvantages over time is the source of increased weight as negative exposures in life experiences build up to increasingly negative outcomes (Cockerham, 2022).
From a fundamental health perspective, one’s position in the social structure shapes access to important resources that can be used to avoid health risks or ameliorate the consequences of disease after its onset (Cockerham, 2022). SES position, racism, and sexism are considered fundamental causes of poor health (Phelan and Link, 2015). Individuals from disadvantaged racialethnic, gender, and SES backgrounds often have less access to tangible and psychosocial health-promoting resources and are exposed to more health-risk factors (Phelan and Link, 2015; Williams, 2012; Hargrove, 2018) and are, therefore, more likely to have higher rates of obesity than individuals in advantaged positions in terms race/ethnicity, gender, and SES.
Social structures, defined as “enduring patterns of social life that shape an individual’s attitudes and beliefs, behaviors and actions, and material and psychological resources” (Williams & Sternthal, 2010: S18), influence life experiences and health over the life course (Schnittker and McLeod, 2005). SES is inversely associated with high quality health care, stress, exposure to social and physical toxins, social support, and health behaviors (Williams and Collins, 1995; Williams & Sternthal, 2010). SES remains one of the strongest determinants of variations in health and partially explains racial-ethnic differences in health (Hayward, Miles, Crimmins, & Yang, 2000; Williams & Collins, 1995; Williams & Sternthal, 2010).
Numerous studies have also shown that racial/ethnic differences in health are large and persist over time (Williams, Mohammed, Leavell, & Collins, 2010; Williams & Sternthal, 2010). Structural systems surrounding race/ethnicity contribute to racial/ethnic differences in health. For example, residential racial segregation is associated with the concentration of poverty, social disorder, social isolation, and creates pathogenic conditions in residential environments (Massey, 2004; Williams & Sternthal, 2010), which in turn influence health. Segregation adversely affects health by reducing access to better quality education and job opportunities; access to nutritious foods and places to exercise regularly; increasing advertisement for tobacco and alcohol; increasing financial and hardship stress and chronic and acute stressors; reducing social capital such as weakening social relationships and trust among neighbors; and by increasing exposure to environmental toxins, poor quality of housing, and criminal victimization (Williams & Sternthal, 2010), all of which have adverse effects on health for disproportionately racial/ ethnic and poor minorities living in residential segregated neighborhoods (Massey, 2004). Race/ethnicity and SES are two related but distinct systems of social ordering that jointly contribute to health risks (Williams & Collins, 1995).
Another social structural dimension associated with health is gender. Gender roles and expectations are assumed to differentially constrain choices for healthy living among men and women. They do that by influencing decisions and policies made at the family, work, and institutional levels, which shape everyday experiences of men and women in ways that may heighten women’s exposure to stress relative to men, block socioeconomic opportunities, and leave women with less time for health-promoting activities (Bird and Ricker, 2008; Read and Gorman, 2010; Hargrove, 2018).
Racial-ethnic and gender inequalities in health persist even after accounting for group differences in SES (Read and Gorman, 2010; Williams, 2012). Race/ethnicity and SES combine with gender and other social statuses in complex ways to create patterns of intersectionality in their effects on health (Schultz & Mullings, 2006). Accordingly, the interplay of race/ethnicity, SES, and gender and how it affects health disparities needs to be taken further into consideration in examining their relative and combined effects on health.
One of the mechanisms through which social structural factors of race/ethnicity, gender, and SES influence obesity may be through stress. Stress has been found to impact obesity (Tomiyama, 2019). It can impact obesity by affecting behaviors such as inducing overeating and consumption of foods that are high in calories, fat, or sugar, by decreasing physical activity, and shortening sleep (Tomiyama, 2019). Individuals in higher status positions tended to have lower stress levels, healthy eating patterns, and lower body weight. Higher stress levels are in turn associated with less healthy dietary behaviors and with higher body weight. These patterns tend to be more pronounced in women than men (Moore and Cunningham, 2012). After adjusting for the effect of SES on obesity, Conklin and colleagues (2013) found that, focusing on financial hardship, having less than enough money for one’s needs, always or often not having enough money for food/clothing, and difficulty paying bills were associated with obesity in women and men and that these relationships were slightly higher for women than men.
Numerous previous studies have found that neighborhood environments are key determinants of individual health. Neighborhood environments shape residents’ resources and opportunities for better health, but at the same time, they expose them to multiple health risks over the life course (Leventhal and Brooks-Gunn, 2000). For example, living in a disadvantaged neighborhood is detrimental to health and is associated with higher prevalence of obesity among both children and adults (Nelson et al., 2006; Morland, Diez Roux and Wing, 2006; Robert and Reither, 2004). Racial/ethnic minorities are further disadvantaged because they tend to cluster in disadvantaged neighborhoods (Massey and Denton, 1993; Wilson, 1987, 1996).
Residents in disadvantaged neighborhoods often have less access to supermarkets and other outlets that provide access to an affordable mix of healthy foods and instead have a higher exposure to fastfood restaurants than residents in higher socioeconomic status neighborhoods (Sallis and Glanz, 2006). In addition, disadvantaged neighborhoods usually have fewer physical activity amenities than affluent neighborhoods, including parks, leading to more inactivity among neighborhood residents (Lovasi et al., 2009; Yen and Kaplan, 1999). Black and Macinko (2007) found that neighborhood features that consistently discourage physical activity were associated with increased BMI. Boehmer and colleagues (2007) found that being obese was significantly associated with perceived indicators of no nearby nonresidential destinations, absence of sidewalks quality, physical disorder, and presence of garbage. Perceived and observed indicators of land use and aesthetics were the most robust neighborhood correlates of obesity (Boehmer et al., 2007). We expect that friendly neighborhood environment to walk will partially explain the racial-ethnic-, gender-, and SES-gaps in obesity.
The objective of this study is to investigate the extent to which race-ethnicity, gender, and SES intersect to influence obesity disparities among adults. I address four research questions: 1) To what extent does obesity vary by race/ethnicity, gender, and SES? 2) To what extent does SES explain racial-ethnic and gender disparities in obesity? 3) Do family economic hardship and psychological distress explain the racialethnic, gender-, and SES- gaps in obesity?, and 4) To what extent does neighborhood walking environment explain the racial-ethnic-, gender-, and SES-gaps in obesity?
Data and Methods
Data
Data are from the National Health Interview Survey (NHIS) in 2020. The 2016 – 2025 NHIS sample design is a multistage probability sample of U.S. households with new households interviewed each year. The survey conducts household interviews throughout the United States and collects information on health status, health-related behaviors, and information on sociodemographic and economic characteristics, including race/ethnicity, gender, SES, and other household characteristics from the U.S. civilian non-institutionalized population. The NHIS interview begins by identifying everyone who usually lives or stays in the household. One adult age 18 years and older and one child age 17 years and younger are randomly selected for interview. Information about the sample child is collected from a parent or adult who is knowledgeable about and responsible for the health care of the sample child.
Due to the COVID-19 pandemic, NHIS data collection in 2020 switched to a telephone-only mode beginning March 2020. Personal visits resumed in September 2020. In addition, from August through December 2020, a subsample of adult respondents who completed the NHIS in 2019 were re-interviewed by telephone and asked to participate again in the survey. The 2020 sample adult file is hence composed of both the reinterview cases and the 2020-sampled cases (n = 31,568). This study uses data on 30.071 cases, excluding respondents of other race category (i.e., Native Americans and Alaska natives and other single or multiple races) (n = 762 or 2.4%), and respondents with missing values on the dependent variable, i.e., Obesity (n = 735 or 2.3%).
Measures
Obesity. The dependent variable is obesity, defined as a body mass index (BMI) greater or equal to 30. BMI is a standard index measure in demographic and health research. This index is calculated as weight (kilograms) divided by height squared (in meters). In the public version of data, BMI was included as a categorical variable (e.g., 1 = underweight, 2 = healthy weight, 3 = overweight, and 4 = obese). We recoded BMI category variable into a dummy variable (1 = obese, 0 = otherwise).
Race/ethnicity. Race/ethnicity is constructed from self-reported ethnicity and race categories. First, Latino adults are distinguished from non-Latino adults. Among Latinos, Mexicans are distinguished from Other Latinos. For non-Latinos, race is categorized as non-Latino white (thereafter, referred as white), African American, or Asian.
Gender. Gender is measured by the sex of the adult respondent and is recorded into a dummy variable, where 1 = female and 0 = male (reference).
Socioeconomic status (SES). SES is measured by two variables: educational attainment and family income. Educational attainment is measured by four dummy variables (i.e., less than high school; high school graduate/GED or equivalent; some college; and college graduate = reference). Household income is measured in 1,000s and is transformed using the natural logarithm to reduced skewness.
Explanatory mechanisms. Four explanatory mechanisms suggested are considered to help explain the race/ethnicity, SES, and gender inequalities in obesity: economic hardship, psychological distress, and neighborhood walking environment.
Economic hardship. Economic hardship is measured by the sum of six dummy variables: problems paying medical bills in the past 12 months, unable to pay medical bills, receive food stamps in the past 12 months, receive WIC benefits in the past 12 months, receive free/reduced meals at school, and food insecurity (α = .61).
Psychological distress. Psychological distress is measured as a mean of two items: anxiety and depression. Anxiety was measured by asking respondents how often they feel worried, nervous, or anxious. Responses were reversed coded as 1 = never, 2 = a few times a year, 3 = monthly, 4 = weekly, and 5 = daily. Depression was measured by asking respondents how often they felt depressed. Responses were also reversed coded as 1 = never, 2 = a few times a year, 3 = monthly, 4 = weekly, and 5 = daily. The two items were average to create an index pf psychological distress (α = .74).
Neighborhood walking environment is measured as a sum of six items. Respondents were asked if where they live had: 1) roads, sidewalks, paths, or trails where they can walk; 2) shops, stores, or markets they can walk to; 3) bus or transit stops they can walk to; 4) places like movies they can walk to; 5) places they can walk to help relax and clear their minds; and that 6) most of the streets have sidewalks. Responses were recoded into dummy variables and then summed to create an index neighborhood walking environment (α = .74).
Control variables. All models adjust for health behaviors, including physical activity (strength only, aerobic only, both strength and aerobic, no physical activity = reference); smoking (current smoker, former smoker, never smoked = reference); drinking (current drinker, former drinker, never drink = reference); and sleeping patterns (1 = sleep 8 hours or more per day, 0 = otherwise) and sociodemographic variables: age (years), immigrant status and duration in the U.S. (foreign-born, < 5 years; foreign-born, 5-9 years; foreign-born, 10-14 years; foreign-born, 15 years or more; native-born = reference), marital status (widowed, divorced/ separated, never married, married/cohabiting = reference), home ownership (1 = housing owner, 0 = renter), region (Northeast, Midwest, South, West = reference), and nonmetropolitan residence (1 = nonmetropolitan, 0 = metropolitan (reference)).
Analytical Strategy
The research questions were addressed in five stages. First, I use descriptive statistics (mean and percentages) of obesity and selected independent variables by race/ethnicity and gender. Racial/ethnic and gender differences of control variables are not presented here but are available upon request. Second, I use logistic regression models of adult obesity and estimate the relative and joint influences of race/ethnicity, gender, and SES. Third, I add economic hardship and psychological distress measures to assess if these two processes may help explain the race/ethnicity, gender, and SES influences on obesity. Fourth, I add a measure of the neighborhood walking environment to assess whether it helps explain the race/ethnicity, gender, and SES influences on obesity. Finally, I run separate models by gender to assess whether the influences of race/ethnicity, SES, economic hardship and psychological distress, and neighborhood walking environment on obesity differ for men and women. All models control for health behaviors and sociodemographic covariates. The analyses are weighted to account the complex NHIS sampling design using the survey module within STATA 15.1 software, which considers stratum and sampling unit identifiers. The Tailor series linearization was used for variance estimation.
| Mexican | Other Latino | African American | Asian | White | ||||||
|---|---|---|---|---|---|---|---|---|---|---|
| Variable | Men | Women | Men | Women | Men | Women | Men | Women | Men | Women |
| Obesity | 41.32a | 40.02a | 33.28 | 35.17 | 30.87ab | 37.55a | 10.24a | 9.45a | 32.68b | 30.87 |
| Education | ||||||||||
| Less than high school | 34.70a | 34.81a | 23.66a | 19.49a | 12.97a | 12.53a | 7.97 | 12.34a | 7.19 | 6.45 |
| High school | 32.54a | 27.64 | 28.63 | 29.03 | 37.87ab | 29.67 | 18.19a | 19.41a | 27.77 | 27.46 |
| Some college | 23.80a | 27.41a | 28.42 | 30.53 | 29.98b | 36.03a | 21.54a | 21.75a | 31.56 | 32.51 |
| College or more | 8.95a | 10.14a | 19.29a | 20.95a | 19.18a | 21.77a | 52.30a | 46.50a | 33.47 | 33.58 |
| Family income (1000s) | 68.57ab | 59.26a | 77.60ab | 65.29a | 67.11ab | 53.88a | 99.74 | 97.21a | 95.27b | 87.64 |
| Economic hardship | 0.80ab | 1.15a | 0.75ab | 0.98 | 0.89ab | 1.10a | 0.36a | 0.38a | 0.33b | 0.49 |
| Psychological distress | 1.78ab | 2.05a | 1.82ab | 2.10a | 1.81ab | 2.04a | 1.71ab | 1.83a | 1.99b | 2.37 |
| Neighborhood walking environment | 4.45a | 4.28a | 4.66a | 4.61a | 4.31a | 4.19a | 4.57a | 4.52a | 3.67b | 3.52 |
a: Difference between racial/ethnic groups (reference = non-Latino white) is significant at p < .05 (two-tailed test)
b: Difference between men and women within race/ethnicity is significant at p < .05 (two-tailed test).
Results
Sample Characteristics
Table 1 displays descriptive statistics of selected variables by race/ethnicity and gender. Mexican men and African American men report significantly higher prevalence of obesity than white men, while Asian men report significantly lower prevalence of obesity than white men. Among women, Mexican women and African American women report significantly higher prevalence of obesity than white women, while Asian women report significantly lower prevalence of obesity than white women.
In terms of educational attainment, Mexican men, Other Latino men, and African American men have lower levels of education than white men. Asian men have significant levels of education than white men. Among women, Mexican women, Other Latino women, African American women have lower levels of education compared to compared to white women. Asian women also have significant levels of education compared to white women. Specifically, 9 percent of Mexican men are college graduates, 19 percent of Other Latino men, 19 percent of African American men, and 52 percent of Asian men, as compared to 33 percent for white men, respectively. Among women, 10 percent of Mexican women are college graduates, 21 percent of Other Latino women, 22 percent of African American women, and 47 percent of Asian women, as compared to 34 percent of white men, respectively. Within racial/ethnic groups, African American men are more likely than African American women to graduate from high school. In contrast, African American women are more likely than African American men to have some college education. Among both men and women, Mexicans, Other Latinos, and African Americans have significantly lower family income than their white counterparts. Asian women have significantly higher family income than white women. Within racial/ethnic groups, Mexican men, African American men, and white men have significantly higher family income than Mexican women, African American women, and white women, respectively. African American women have lower family income than any other racial/ethnic and gender groups.
Mexican men, Other Latino men, African American men, and Asian men report significantly more economic hardship than white men. Mexican women and African American women report significantly more economic hardship than white women. Asian women report significantly lower economic hardship than their white women counterparts. Within racial/ ethnic groups, Mexican women and African American women report significantly higher economic hardship than Mexican men and African American men, respectively. White women report significantly more economic hardship than white men. Mexican men, Other Latino men, African American men, and Asian men report significantly lower psychological distress than white men. Mexican women, Other Latino women, African American women, and Asian women report significantly lower psychological distress than white women. Within racial/ ethnic groups, women report significantly more psychological distress than men. Among both men and women, Mexicans, Other Latinos, African Americans, and Asians report living in significantly better neighborhood walking environments than their white counterparts. White men report living in significantly better neighborhood walking environments than white women.
Multivariate Results
Tables 2 through 4 display the odds of obesity by race/ethnicity, gender, SES, family processes, and perceptions of neighborhood walking environment from the logistic regression models. Table 2 shows the odds of obesity by those social environmental factors for the total sample. Tables 3 and 4 indicate that there are significant race/ethnicity, SES, family processes, and neighborhood walking environment variations by gender. All logistic regression models control for health behaviors (physical activity, smoking, drinking, and sleeping patterns) and sociodemographic (age, immigrant status, marital status, employment status, homeownership, nonmetropolitan area, and region) covariates.
| Variable | Model 1 | Model 2 | Model 3 | Model 4 |
|---|---|---|---|---|
| Race/ethnicity (0 = non-Latino white) | ||||
| Mexican | 1.847*** | 1.651*** | 1.676*** | 1.708*** |
| Other Latino | 1.388*** | 1.287*** | 1.286*** | 1.343*** |
| African American | 1.727*** | 1.617*** | 1.613*** | 1.674*** |
| Asian | .354*** | .372*** | .383*** | 391*** |
| Gender (0 = male) | ||||
| Female | .959 | .951 | .912** | .905*** |
| Education (0 = college graduate) | ||||
| Less than high school | 1.397*** | 1.352*** | 1.321*** | |
| High school | 1.504*** | 1.500*** | 1.471*** | |
| Some college | 1.496*** | 1.495*** | 1.476*** | |
| Log of Family income ($1,000s) | .905*** | .952 | .955 | |
| Economic hardship | 1.211*** | 1.208*** | ||
| Psychological distress | 1.079*** | 1.080*** | ||
| Neighborhood walking environment | .941*** | |||
| Intercept | .884 | .949 | .650* | .830 |
| Model fit | F (33, 540) = 41.63*** | F (37, 536) =42.54*** | F (40, 533) = 43.56*** | F (42, 531) = 42.24*** |
Notes: Two-tailed tests: *** p < .001; ** p < .01; * p < .05. All models control for age, immigrant status and duration in the U.S., marital status, employment status, homeownership, length of residence, health behaviors, region, and nonmetropolitan residence.
Model 1 in Table 2 shows that the odds of obesity are 85 percent (i.e., [(1.847 – 1) x 100]) higher for Mexicans, 39 percent higher for Other Latinos, and 73 percent higher for African Americans than they are for whites, respectively. In contrast, the odds of obesity are 65 percent (i.e., [(1 - 0.354) x 100]) lower for Asians than they are for whites.
Model 2 of Table 2 adds SES measures, including educational attainment and family income. Estimated effects of SES on obesity are in the expected direction. Specifically, the odds of obesity are 40 percent higher for adults with less than a high school diploma, 50 percent higher for those with a high school diploma, and 50 percent higher for those with some college education than those of college graduate adults, respectively. The odds of obesity decrease by 9 percent for each additional increase in the logarithm of family income. Once SES measures are added to the regression equation in Model 2, the relationship between race/ ethnicity and obesity (from Model 1) is reduced by approximately 10 percent (1.847 – 1.657)/1.847) for Mexicans, 7 percent for other Latinos, and 6 percent for African Americans, but increased for Asians by 6 percent, respectively. These results suggest that SES partially explains the racial/ethnic gaps in obesity and does not confer the same health benefits across racial-ethnic groups.
Model 3 adds family economic hardship and psychological distress. The results in Model 3 show that the odds of obesity are 21 percent higher for each unit increase in economic hardship and 8 percent higher for each unit increase in psychological distress. Once these family processes are added to the regression equation in model 3, the relationship between family income and obesity increases by 5 percent and is rendered not significant.
Model 4 adds the perception of the walking environment. The results in Model 4 show that the odds of obesity are 6 percent lower for each unit increase in the perception of a friendly walking environment. Notice that racial/ethnic, gender, and SES gaps in obesity persisted and remained substantial even after taking into consideration family processes, the perceptions of a friendly walking and safety environments, health behaviors, and sociodemographic covariates in the regression equation in Model 4. Mexicans, Other Latinos, and African American have 1.7, 1.3, and 1.7 times higher adjusted odds of obesity than their white counterparts, respectively. Asians have 0.4 times lower adjusted odds of obesity than their white counterparts. Females have 0.91 times lower adjusted odds of obesity than their male counterparts. In terms of SES, only education remained significantly related to obesity after all controls. Family income was no longer significantly related to obesity. Adults with less than a high school education, a high school diploma, and some college have 1.3, 1.5, and 1.5 times higher adjusted odds of obesity than adults with a college degree or higher, respectively.
| Model 1 | Model 2 | |||||
|---|---|---|---|---|---|---|
| Men | Women | m#wa | Men | Women | m#w | |
| Race/ethnicity (0 = non-Latino white) | ||||||
| Mexican | 2.078*** | 1.629*** | 1.929*** | 1.428*** | † | |
| Other Latino | 1.397** | 1.377** | 1.325* | 1.257* | ||
| African American | 1.343*** | 2.032*** | ††† | 1.274** | 1.905*** | ††† |
| Asian | .392*** | 0.307*** | .418*** | 323*** | ||
| Education (0 = college graduate) | ||||||
| Less than high school | 1.387** | 1.411*** | ||||
| High school | 1.643*** | 1.395*** | ||||
| Some college | 1.560*** | 1.442*** | ||||
| Log of Family income ($1,000s) | 1.009 | .824*** | † | |||
| Intercept | .727* | .949 | .531** | 1.442 | ||
| Model fit | F (32, 541) = 18.16*** | F (32, 541) = 23.56*** | F (36, 537) = 18.18*** | F (36, 537) = 24.35*** | ||
Notes: Two-tailed tests: *** p < .001; ** p < .01; * p < .05. All models control for age, immigrant status and duration in the U.S., marital status, employment status, homeownership, length of residence, health behaviors, region, and nonmetropolitan residence. Two-tailed tests for group differences: ††† p < .001; †† p < .01; † p < .05. a m#w indicates the tests for group differences between men and women.
| Model 1 | Model 2 | |||||
| UNFINISHED | Men | Women | m#wa | Men | Women | m#w |
| Race/ethnicity (0 = non-Latino white) | ||||||
| Mexican | 1.933*** | 1.479*** | 1.995*** | 1.488*** | † | |
| Other Latino | 1.325** | 1.272* | 1.397** | 1.314* | ||
| African American | 1.255** | 1.964*** | ††† | 1.321** | 2.010*** | ††† |
| Asian | .421*** | .340*** | .434*** | .345*** | ||
| Education (0 = college graduate) | ||||||
| Less than high school | 1.361** | 1.337** | 1.311* | 1.319** | ||
| High school | 1.638*** | 1.384*** | 1.597*** | 1.363*** | ||
| Some college | 1.563*** | 1.427*** | 1.542*** | 1.411*** | ||
| Log of Family income ($1,000s) | 1.040 | .879*** | ††† | 1.042 | .883*** | † |
| Economic hardship | 1.131* | 1.264*** | 1.334* | 1.256*** | ||
| Psychological distress | 1.141 | 1.125*** | † | 1.043 | 1.124*** | † |
| Neighborhood walking environment | .923*** | .959** | ||||
| Intercept | .508* | .680 | .727 | .775 | ||
| Model fit | F (39, 534) = 17.42*** | F (39, 534) = 24.34*** | F (41, 532) = 17.41*** | F (41, 532) = 24.15*** | ||
Notes: Two-tailed tests: *** p < .001; ** p < .01; * p < .05. All models control for age, immigrant status and duration in the U.S., marital status, employment status, homeownership, length of residence, health behaviors, region, and nonmetropolitan residence. Two-tailed tests for group di erences: ††† p < .001; †† p < .01; † p < .05. a m#w indicates the tests for group di erences between men and women.
Tables 3 and 4 present the estimated odds of obesity differences by race/ethnicity, SES, and gender. Table 3 shows the estimated odds of obesity by race/ethnicity (Model 1) and by SES (Model 2) separately for men and women. Results from Model 1 of Table 3 show that the odds of obesity for Mexican men are 2.1 times higher than those of white men. Comparatively, the odds of obesity for Mexican women are 1.6 times higher than those of white women. The odds of obesity are 1.4 times higher for Other Latino men and Other Latino women than those of their white men and women counterparts. The odds of obesity for African American men are 1.3 times higher than those of white men. In contrast, the odds of obesity for African American women are twice those of white women. The odds of obesity for African American men are significantly lower when compared to those of African American women. The two-tailed test (shown in Model 1 of Table 3) shows the gender difference in obesity between African American men and women is statistically significant. Results in Model 1 of Table 3 also show that the odds of obesity for Asian men are 0.4 times lower than those of white men. Comparatively, the odds of obesity for Asian women are 0.3 times lower than those of white women.
In Model 2 of Table 3, SES measures are added as covariates. This results in little change in terms of the racial/ethnic gaps in obesity – the odds of obesity for Mexican, Other Latino, and African American men and women are significantly higher than those of white men and women whereas the odds of obesity for Asian men and women are significantly lower than those of white men and women. Adding SES to the logistic regression equation in Model 2 reduces slightly more the odds of obesity among women than among men and increases slightly more the odds of obesity for Asian men than Asian women. Model 2 of Table 3 also show that there are significant differences in obesity between African American men and African American women and between Mexican men and Mexican women. The effect of family income on obesity is significant for women but not for men. The results in both Model 1 and Model 2 support the “fundamental causes of health” perspective, which posits that one’s position in the social structure shapes access to important resources that can be used to avoid health risks or ameliorate the consequences of disease after its onset. Mexicans, other Latinos, and African Americans, especially African American women, and those in lower SES are significantly more likely to have higher odds of obesity than their white, male, and higher SES counterparts.
In Model 1 of Table 4, family economic hardship and psychological distress are added as covariates. Do the effects of these family processes on obesity vary by gender? The results show that the odds of obesity are significantly higher for each unit increase in economic hardship and psychological distress for both men and women. The two-tailed t-test (shown in Model 3 of Table 4) shows a significant gender difference in the effect of psychological distress on obesity. The results in Model 1 of Table 4 also show a significant gender difference in the effect of family income on obesity.
In Model 2 of Table 4, the perception of neighborhood walking environments is added as a covariate. The results reveal that only the perception of neighborhood walking environment is significant for both men and women. The odds of obesity are 8 percent lower for men and 4 percent lower for women for each unit increase in the perception of a neighborhood walking environment. Adding all covariates in the final models altered the racial-ethnic, gender, and SES gaps in obesity, but those gaps remain.
The results in Model 2 of Table 4 show that the adjusted odds of obesity remain significantly higher for those with less than high school education, high school graduate, and those with some college education than those of college graduate men and women. The effect of family income on obesity was only significant among women but not among men. The effect of economic hardship on obesity remains positive for both men and women whereas the effect of psychologic distress on obesity remains significant only for women. Neighborhood walking environment remains negatively associated with obesity for both men and women.

Figure 1. Adjusted Predicted Probability of Obesity by Race/Ethnicity and Gender
Using the results in Model 2 of Table 4, Figure 1 displays the adjusted predicted probability of obesity by race/ethnicity and gender. The adjusted predicted probability of obesity remains significantly higher for Mexican men and women, Other Latino men and women, African American men, and African American women than those of white men and women. The adjusted predicted probability of obesity remains lower for Asian men and Asian women than those of white men and women respectively. African American women have the highest predicted probability of obesity than any other racial-ethnic/gender groups (Figure 1).
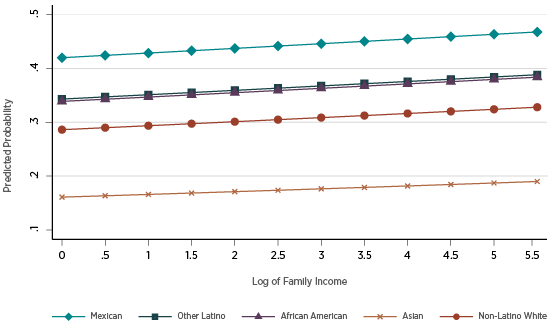
Figure 2. Adjusted Predicted Probability of Obesity by Family Income and Race/Ethnicity among Men
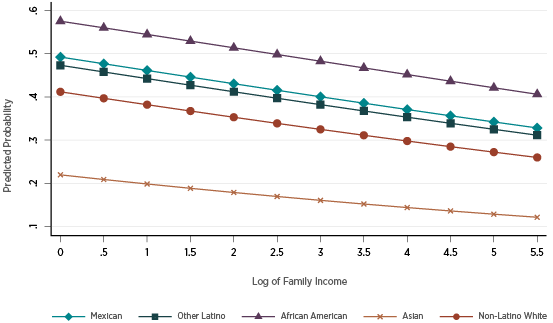
Figure 3. Adjusted Predicted Probability of Obesity by Family Income and Race/Ethnicity among Women
Figures 2 and 3 display the adjusted predicted probability of obesity by race/ethnicity, gender, and SES, using only family income. The adjusted predicted probability of obesity by family and race/ethnicity among men is displayed in Figure 2 whereas the adjusted predicted probability of obesity by family and race/ethnicity among women is displayed in Figure 3. Figure 2 reveals that the adjusted probability of obesity among men is higher for Mexican men, African American men, and Other Latino men than white men. The adjusted probability of obesity is highest among Mexican men and lowest among Asian men. The racial-ethnic gaps in adjusted probability of obesity increase as family income increases (Figure 2). Figure 3 reveals that the adjusted probability of obesity among women is higher for African American women, followed by Mexican women, Other Latino women, and white women. The adjusted probability of obesity is highest among African American women and lowest among Asian women. In contrast to men, the racial-ethnic gaps in adjusted probability of obesity decrease as family income increases (Figure 3).
Discussion
This study addresses racial/ethnic, gender, and SES disparities in adult obesity in the United States. First, this study examines the relative and combined influences of these social structural dimensions of race/ethnicity, gender, and SES on adult obesity. In addition, this study examines three mechanisms through which social structural factors of race/ethnicity, gender, and SES influence obesity: economic hardship and psychological distress at the family level and living in friendly neighborhood walking environment. First, findings from logistic regression models suggest that Mexicans, Other Latinos, and African Americans have, as expected, higher odds of obesity as compared to whites, whereas the odds of obesity for Asians are significantly lower than those of whites. These racial-ethnic disparities in obesity remain significant even after adjusting for age, immigrant status, marital status, homeownership, health behaviors (i.e., physical activity, smoking, drinking, and hours of sleep), nonmetropolitan residence, and region.
Findings suggest that SES partially explains the racial-ethnic gaps in obesity, but those gaps persist. Adults with lower levels of education (less than high school, high school graduate, or some college) exhibit higher odds of obesity than adults with higher levels of education (i.e., those with a college degree or higher). As expected also, the odds of obesity decrease as family income increases. Findings also suggest that SES does not confer the same benefits across racial-ethnic groups. This is also consistent with previous work that showed that there are diminishing returns to health of socioeconomic mobility among racial-ethnic groups (Brown et al., 2016; Walsemann et al., 2012).
Findings suggest that economic hardship and psychological distress are associated with increased odds of obesity and partially explain the racial-ethnic, gender, and SES gaps in obesity. They reduce the gender gap in obesity between men and women, suggesting that economic hardship and psychological distress partially explain the effect of family income on obesity. In terms of race/ethnicity, these family processes minimally reduce the racial-ethnic gaps in obesity.
Findings also show that the odds of obesity are negatively associated with the perception of neighborhood walking environment, i.e., places where they can walk and places where most of the streets have sidewalks. Results indicate that racial/ethnic-, gender-, and SES-gaps in obesity persisted and remained substantial even after taking into consideration economic hardship, psychological stress, the perception of a friendly neighborhood walking environment, controlling for health behaviors and sociodemographic covariates. Specifically, Mexicans, Other Latinos, and African Americans have higher odds of obesity than whites whereas Asians have lower odds of obesity than whites. Females have lower odds than males. Adults with lower levels of education (i.e., those with less than high school education, high school graduates, and those with some college education) have higher odds of obesity than college graduates. The odds of obesity decrease as family income increases. These results suggest that individuals in a lower social position in a social structure, whether based on race/ ethnicity, gender, or SES, experience higher rates of obesity.
The important contribution of this study is the analysis of the intersection of race-ethnicity, gender, and SES and their combined influences on adult obesity. Results show that racial-ethnic inequalities in obesity vary by gender such that the Mexican-white gap in obesity is greater among men than women; Other Latino white gap is slightly higher among men than women; African American-white gap is higher among women than men; and Asian-white gap in obesity is higher among men than women. African American women have the highest odds of obesity than any other racial-ethnic/gender groups. Moreover, results indicate that SES differentially influences obesity among men and women. These findings suggest differential effects of SES on obesity across racial-ethnic and gender groups. This study also considers the intersection of SES, race/ethnicity, and gender, which are three different but interrelated systems that individually or jointly affect obesity, especially those in lower social position such as minorities (e.g., Mexican, Other Latino, and African American) and women. These social structural positions affect life experiences and health, and in this case obesity.
This study also considers stress, including financial/ economic hardship and psychological distress, and how it influences obesity. Stress imposes strain on relationships and may adversely affects health and obesity. Racial-ethnic minorities, especially those in lower class and women, are disproportionately socially disadvantaged in terms opportunities/constraints and resources, and stress, which may in turn influence obesity. African Americans, particularly women, experience the highest poverty, lack of resources, and more stressful conditions. Racial/ethnic segregation and discrimination disproportionately expose minorities, especially African Americans, to poverty and more stress (Williams and Sternthal, 2010). Living in friendly neighborhood walking environment, i.e., places where people can walk and most streets have sidewalks, is negatively associated with obesity.
This study is not without limitations. First, while the analysis controls for health behaviors, including physical activity, smoking, drinking, and sleep, nutritional patterns were missing in the data. Second, this study is cross-sectional and uses only one year of data. Future research will use a life course perspective to assess the relative and joint effect of SES, gender, and race/ethnicity on obesity using multiple years of data collected by NHIS. Third, questions related to neighborhood walking environment were asked, but other neighborhood social structural, nutritional and physical environments are lacking. Future research will consider access to de-identified data that will permit merging other neighborhood social structural, nutritional, and physical environments. Finally, another limitation relates to issues of causality and selection. Future research will consider longitudinal and multilevel data that will analyze the effects of social structures and processes, at the family and neighborhood levels, on obesity over time.
Conclusion
This study reaffirms social structural and disadvantaged positions of racial/ethnic, gender, and SES and their relative and joint influences on obesity. Findings show that individuals in disadvantaged social structural positions such as minorities (e.g., Mexican, Other Latino, and African American, women, particularly African American women, and those with lower SES) have higher rates of obesity than those in advantageous social structural positions. Racial/ethnic, gender, and SES inequalities in obesity persist and remain substantial even after taking into consideration stress, the perception of neighborhood walking environment, health behaviors, and sociodemographic covariates. Thus, racial-ethnic minorities, women, and those in lower SES are disproportionately disadvantaged in terms opportunities/ constraints and resources, stress levels, and neighborhood environments, which may in turn influence obesity.
References
Ailshire, J. A., & House, J. S. (2011). The unequal burden of weight gain: An intersectional approach to understanding social disparities in BMI trajectories from 1986 to 2001/2002. Social forces, 90(2), 397-423.
Bird, C. E., & Rieker, P. P. (2008). Gender and health (p. 256). New York: Cambridge University Press.
Black, J. L., & Macinko, J. (2010). The changing distribution and determinants of obesity in the neighborhoods of New York City, 2003–2007. American journal of epidemiology, 171(7), 765-775.
Boehmer, T. K., Hoehner, C. M., Deshpande, A. D., Brennan Ramirez, L. K., & Brownson, R. C. (2007). Perceived and observed neighborhood indicators of obesity among urban adults. International journal of obesity, 31(6), 968-977.
Clarke, P., O’Malley, P. M., Johnston, L. D., & Schulenberg, J. E. (2009). Social disparities in BMI trajectories across adulthood by gender, race/ ethnicity, and lifetime socio-economic position: 1986–2004. International Journal of Epidemiology, 38(2), 499-509.
Cockerham, W. C. (2022). Theoretical approaches to research on the social determinants of obesity. American Journal of Preventive Medicine, 63(1), S8-S17.
Conklin, A. I., Forouhi, N. G., Suhrcke, M., Surtees, P., Wareham, N. J., & Monsivais, P. (2013). Socioeconomic status, financial hardship and measured obesity in older adults: a cross-sectional study of the EPICNorfolk cohort. BMC public health, 13(1), 1-10.
Flegal, K. M., Carroll, M. D., Kit, B. K., & Ogden, C. L. (2012). Prevalence of obesity and trends in the distribution of body mass index among US adults, 1999-2010. Jama, 307(5), 491-497.
Hargrove, T. W. (2018). Intersecting social inequalities and body mass index trajectories from adolescence to early adulthood. Journal of Health and Social Behavior, 59(1), 56-73.
Hayward, M. D., Miles, T. P., Crimmins, E. M., & Yang, Y. (2000). The significance of socioeconomic status in explaining the racial gap in chronic health conditions. American sociological review, 910-930.
Leventhal, T., & Brooks-Gunn, J. (2000). The Neighborhood they live in: The effects of neighborhood residence on child and adolescent outcomes.” Psychological Bulletin 126(2): 309-337.
Liu, H., & Guo, G. (2015). Lifetime socioeconomic status, historical context, and genetic inheritance in shaping body mass in middle and late adulthood. American sociological review, 80(4), 705-737.
Lovasi, G. S., Hutson, M. A., Guerra, M., & Neckerman, K. M. (2009). Built environments and obesity in disadvantaged populations. Epidemiologic Reviews 31(1), 7-20.
Massey, D., & Denton, N. A. (1993). American apartheid: Segregation and the making of the underclass. Boston: Harvard University Press.
Massey, D. S. (2004). Segregation and stratification: a biosocial perspective. Du Bois Review: Social Science Research on Race, 1(1), 7-25.
Moore, C. J., & Cunningham, S. A. (2012). Social position, psychological stress, and obesity: a systematic review. Journal of the Academy of Nutrition and Dietetics, 112(4), 518-526.
Morland, K., Diez Roux, A. V., & Wing, S. (2006). Supermarkets, other food stores, and obesity: the atherosclerosis risk in communities study. American journal of preventive medicine, 30(4), 333-339.
Mueller, A. S., Pearson, J., Muller, C., Frank, K., & Turner, A. (2010). Sizing up peers: Adolescent girls’ weight control and social comparison in the school context. Journal of Health and Social Behavior, 51(1), 64-78.
Nelson, M. C., Gordon-Larsen, P., Song, Y., & Popkin, B. M. (2006). Built and social environments: Associations with adolescent overweight and activity. American Journal of Preventive Medicine, 31(2): 109-117
Ogden, C. L., Lamb, M. M., Carroll, M. D., & Flegal, K. M. (2010). Obesity and socioeconomic status in adults: United States 1988–1994 and 2005– 2008. NCHS data brief, 50, 1-8.
Ogden, C. L., Carroll, M. D., Kit, B. K., & Flegal, K. M. (2014). Prevalence of childhood and adult obesity in the United States, 2011-2012. Jama, 311(8), 806-814.
Ogden, C. L., Fakhouri, T. H., Carroll, M. D., Hales, C. M., Fryar, C. D., Li, X., & Freedman, D. S. (2017). Prevalence of obesity among adults, by household income and education—United States, 2011–2014. Morbidity and Mortality Weekly Report, 66(50), 1369.
Phelan, J. C., & Link, B. G. (2015). Is racism a fundamental cause of inequalities in health?. Annual Review of Sociology, 41, 311-330.
Pudrovska, T., Reither, E. N., Logan, E. S., & Sherman-Wilkins, K. J. (2014). Gender and reinforcing associations between socioeconomic disadvantage and body mass over the life course. Journal of health and social behavior, 55(3), 283-301.
Read, J. N. G., & Gorman, B. K. (2010). Gender and health inequality. Annual review of sociology, 36, 371-386.
Robert, S. A, & Reither, E. N. (2004). A Multilevel analysis of race, community disadvantage, and BMI. Social Science and Medicine 59(12), 2421-2434.
Sallis, J. F., & Glanz, K. (2006). The Role of built environments in physical activity, eating, and obesity in childhood. The Future of Children, 16(1), 89-108.
Schmeer, K. K. (2010). Household income during childhood and young adult weight status: Evidence from a nutrition transition setting. Journal of Health and Social Behavior, 51(1), 79-91.
Schultz, A. J., & Mullings, L. E. (2006). Gender, race, class, & health: Intersectional approaches. Jossey-Bass/Wiley.
Schnittker, J., & McLeod, J. D. (2005). The social psychology of health disparities. Annu. Rev. Sociol., 31, 75-103.
Stierman B, Afful J, Carroll MD, Chen TC, Davy O, Fink S, et al. National Health and Nutrition Examination Survey 2017–March 2020 pre-pandemic data files—Development of files and prevalence estimates for selected health outcomes. National Health Statistics Reports; no 158. Hyattsville, MD: National Center for Health Statistics. 2021. DOI: https://dx.doi.org/10.15620/cdc:106273.
Tomiyama, A. J. (2019). Stress and obesity. Annual review of psychology, 70, 703-718.
Wang, Y., & Beydoun, M. A. (2007). The obesity epidemic in the United States—gender, age, socioeconomic, racial/ethnic, and geographic characteristics: a systematic review and meta-regression analysis. Epidemiologic reviews, 29(1), 6-28.
Ward ZJ, Bleich SN, Long MW, Gortmaker SL (2021) Association of body mass index with health care expenditures in the United States by age and sex. PLOS ONE 16(3): e0247307. https://doi.org/10.1371/journal.pone.0247307.
Williams, D. R., & Collins, C. (1995). US socioeconomic and racial differences in health: patterns and explanations. Annual review of sociology, 21(1), 349-386.
Williams, D. R., & Sternthal, M. (2010). Understanding racial-ethnic disparities in health: sociological contributions. Journal of health and social behavior, 51(1_suppl), S15-S27.
Williams, D. R. (2012). Miles to go before we sleep: Racial inequities in health. Journal health and social behavior, 53(3), 279-295.
Williams, D. R., Mohammed, S. A., Leavell, J., & Collins, C. (2010). Race, socioeconomic status, and health: complexities, ongoing challenges, and research opportunities. Annals of the new York Academy of Sciences, 1186(1), 69-101.
Wilson, W. J. (1987). The Truly disadvantaged: The inner city, the underclass, and public policy. Chicago: University Press.
Wilson, W. J. (1906). When work disappears. New York, NY: Knopf.
Yen, I. H., & Kaplan, G. A. (1999). Neighborhood social environment and risk of death: Multilevel evidence from the Alameda county study. American Journal of Epidemiology, 149(10): 898-907.