
Racial/Ethnic and Socioeconomic Disparities in Health
.jpg)
Introduction
Racial/ethnic and socioeconomic differences in health have persisted in the United States. Recent mortality data provide a glimpse of health status in the United States. The age-adjusted death rate in 2018 was highest among African Americans (892.6 per 100,000 population), followed by American Indian and Alaska Natives (AIAN) (790.8 per 100,000 population), Whites (748.7 deaths per 100,000 population), Native Hawaiian and Pacific Islanders (NHOPI) (675.7 per 100,000 population), Latinos (524.1 per 100,000 population), and Asians (381.2 per 100,000 population). The age-adjusted mortality rate was higher for males than for females in each racial/ethnic group. The highest age-adjusted mortality rate was highest among African American males (1,102.8 per 100,000 population) (Murphy et al., 2021).
In 2019, life expectancy at birth was 78.8 years in the United States. The Asian population had the highest life expectancy at birth (85.6 years), with an advantage of 3.7 years over the Latino population (81.9 years), 6.8 years over the White population (78.8 years), 10.8 years over the African American population (74.8 years), and 13.8 years over the American Indian and Alaska Native population (AIAN) (71.8 years) (Aries E and Xu JQ, 2022). Life expectancy at birth varies significantly by gender and race/ethnicity. In 2019, Asian females had the highest life expectancy at birth (87.4 years), followed by Latinas (84.4 years), Asian males (83.5 years), White females (81.3 years), Latino males (79.1 years), Black/African American females (78.1 years), White males (76.3 years), AIAN females (75.0 years), African American males (71.3 years, and AIAN males (68.6 years) (Aries E and Xu JQ, 2022).
There is significant variation across racial/ethnicgroups in the top 10 leading causes of death in 2018. Heart disease was the first leading cause of death for White, African American, AIAN, and Native Hawaiian and Other Pacific Islander (NHOPI) populations, but it was the second leading cause for Asian and Latino populations. Cancer was the first leading cause of death for Asian and Latino populations, but it was the second leading cause for White, African American, AIAN, and NHOPI populations. Unintentional injuries, stroke, diabetes, and kidney disease also ranked among the top 10 causes of death for each racial/ethnic group (Heron, 2021).
What has been consistent for much research regarding the relationship between race/ethnicity and health is that African Americans have higher mortality and poorer health status than does any other groups, as do Native Americans. Mortality rates are also higher for Whites than for Latinos or Asians, although relative mortality varies for specific causes of death (Adler and Rehkopf, 2008; Singh and Hiatt, 2006; Williams et al., 2010). A large body of research and reviews also show that socioeconomic status (SES) remains a fundamental cause of health disparities. Individuals at higher SES tend to do better on most measures of health than their lower SES counterparts (Lynch and Kaplan, 2000; Braverman et. al., 2010; Williams and Collins, 2016). Although SES often account for a large part of racial/ethnic differences in health, racial/ethnic disparities in health persist (Kayitsinga and Martinez, 2008; Adler and Rehkopf, 2008; Williams, 1999; Williams, Priest, and Anderson, 2016).
This study is important for policymakers and scholars to understand and highlight the continued and persistent racial/ ethnic and SES disparities in health in the United States. The main objective of this study is to determine the main, relative, and combined influences of race/ethnicity and SES on the health status of adults in the United States. This study addresses threemain questions: (1) What is the influence of race/ethnicity on
health? (2) What is the influence of SES on health? and (3) To what extent does SES explain racial/ethnic disparities in health?
Background
Race/Ethnicity and Health
A large body of research highlights racial/ethnic differences in health (Williams and Collins, 1995; Williams and Sternthal, 2010). Williams and Sternthal (2010) showed that the racial gap in health is large and persistent overtime. Race/ethnicity is a socially constructed category that has a tremendous effect on health. Factors such as racism, segregation, discrimination, and lack of better economic opportunities, create social and spatial contexts that may expose individuals to poor health conditions and death. There is mounting evidence that racism adversely affects health through multiple mechanisms (Williams and Mohammed, 2013; Williams and Mohammed, 2009). Racism, in both its institutional and individual forms, remains an important determinant of racial/ethnic disparities in health (Williams, 2012).
Williams and Collins (2016) argue that racial residential segregation is a fundamental cause of racial disparities in health. Using the example of African American segregation, they argue that the physical separation of the races by enforced residence in certain areas is an institutional mechanism of racism that was designed to protect whites from social integration with African Americans. Despite its legal nature, residential segregation remains extremely high for most African Americans in the United States. They also show that segregation is the primary cause of racial differences in SES by determining access to education and employment opportunities.
For Latinos, especially those of Mexican background, it remains a paradox why they exhibit better health than Whites despite having lower levels of SES and relatively lower levels of access to health insurance in the United States (Markides and Eschbach, 2005). What has been evident is that newly arrived immigrants exhibit better health than similar natives do, and immigrants’ health advantage deteriorates with increasing duration in the U.S. and greater levels of acculturation (Cho et al., 2004; Hummer et al., 2007). The rationale is that the longer immigrants stay in the U.S. the greater the likelihood of losing their traditional lifestyle, which buffers against unhealthful behaviors. There is some evidence that second generation Latinos have poorer health than Latino immigrants despite having higher levelsof SES than their first-generation peers (Collins et al., 2001).
Socioeconomic Status (SES) and Health
Another social construct that captures differential exposure to conditions of life that have health consequences is SES. A large body of research evidence shows that SES remains a fundamental cause of health disparities (Williams and Collins, 2016). Individuals at higher SES do better on most measures of health than their lower SES counterparts (Lynch and Kaplan, 2000; House, 2000; Braverman et. al., 2010). Braverman and colleagues (2010) show that individuals with the lowest income and who were least educated were consistently unhealthy, but for most indicators, even groups with intermediate income and education levels were less healthy than the wealthiest and most educated. They showed that gradient patterns were seen often among African Americans and Whites, but less consistent among Latinos.
The pathways through which SES affects individuals’ health include exposure to both health-damaging conditions and health-protecting resources (Adler and Rehkopf, 2008). Some exposures have direct effects on health, while others influence psychosocial and behavioral factors such as cognition and emotion (e.g., depression, hopelessness, hostility, and lack of control) and behaviors (e.g., use of cigarettes, alcohol, and other substances) (Adler and Rehkopf, 2008). Health-damaging exposures include early life conditions, inadequate nutrition, poor housing, exposure to lead and other toxins, inadequate health care, unsafe working conditions, uncontrollable stressors, social exclusion, and discrimination (Adler and Rehkopf, 2008; Williams and Collins, 1995).
Living in disadvantaged neighborhoods also expose individuals to greater uncertainty, conflict, and threats for which there are often inadequate resources to respond effectively. These experiences accumulate to create chronic stress among individuals subjected to prolonged exposure to such conditions (Adler and Rehkopf, 2008). Poor and low-income individuals are disadvantaged with respect to lifestyles, as they are more likely to engage in unhealthy behaviors such as smoking, unhealthy eating and drinking practices, and lower levels of physical activity across adulthood (Cockerham, 2005). In contrast, the upper and middle classes tend to adopt healthier lifestyles by engaging in leisure-time sports and exercise, healthier diets, moderate drinking, less smoking, more physical checkups by their physicians, and greater opportunities for rest, relaxation, and coping with stress (Cockerham, 2005; Robert and House, 2000; Snead and Cockerham, 2002).
Intersection of Race/Ethnicity and SES and Health
Race/ethnicity and SES are interlinked and both influence conditions of life that have health consequences. SES accounts for a large part of racial/ethnic differences in health. Nonetheless, racial/ethnic disparities in health persist (Kayitsinga and Martinez, 2008; Adler and Rehkopf, 2008; Williams, 1999; Williams, Priest, and Anderson, 2016). Williams and colleagues (2010) reviewed studies that show that differences in SES across racial groups are a major contributor to racial disparities in health. However, they add that race reflects multiple dimensions of social inequality and individual and household indicators of SES capture relevant but limited aspects of this phenomenon. Therefore, to understand the widening gaps in health status, one must look at the separate and combined effects of race/ethnicity and SES on health.
Hypothesis
Because SES remains a fundamental cause of health disparities (Williams and Collins, 2016), this study hypothesizes that individuals with higher SES will likely report better health than their lower SES counterparts. This study further hypothesizes that SES will account for a large part of racial/ ethnic differences in health, but racial/ethnic differences in health will remain. More specifically, this study hypothesizes that gaps in self-rated health are more likely to narrow among African Americans than Whites and among Asians than Whites but are likely to increase more among Mexicans and other Latinos than Whites once SES is taken into consideration. The intent of this paper is to estimate racial/ethnic differences in health, SES differences in health, and how much SES might contribute to racial/ethnic disparities in self-rated health.
Data and Methods
Data
Data are from the National Health Interview Survey (NHIS) in 2019 to 2021. The three years were merged together to provide enough sample size to assess racial/ethnic and socioeconomic status (SES) differences in health. The 2016 – 2025 NHIS sample design is a multi-stage probability sample of U.S. households with new households interviewed each year. The survey conducts household interviews throughout the United States (U.S.) and collects information on health status, health-related behaviors, and information on sociodemographic and economic characteristics, including race/ethnicity, gender, SES, and other household characteristics from the U.S. civilian non-institutionalized population. The NHIS interview begins by identifying everyone who usually lives or stays in the household. One adult aged 18 years and older and one child aged 17 years and younger are randomly selected for an interview. Information about the sample child is collected from a parent or adult who is knowledgeable about and responsible for the health care of the sample child.
Due to the COVID-19 pandemic, NHIS data collection in 2020 switched to a telephone-only mode beginning March 2020. Personal visits resumed in September 2020. In addition, from August through December 2020, a subsample of adult respondents who completed the NHIS in 2019 were re-interviewed by telephone and asked to participate again in the survey. The 2020 sample adult file is hence composed of both the re-interview cases and the 2020-sampled cases (n = 31,568). Adding the 2019 NHIS sample of 31,997 adult respondents, and the 2021 sample adults (n = 29,482), the 2019–2021 combined sample is composed of 93,047 adults age 18 years and older. This study uses data on 91,713 Latino, African American, Asian, and White respondents, excluding other races (n = 2,334 (2.5%).
Measures
Health. The dependent variable is self-rated health status. Self-rated health is measured with the question that captures the subjective measure of general health status: “Would you say your health in general is excellent, very good, good, fair, or poor?” Responses to the item were reverse coded so that higher values indicate better health: 1 = poor, 2 = fair, 3 = good, 4 = very good, and 5 = excellent. The reliability and validity of self-rated health is well established (Idler and Benyamini, 1997).
Race/ethnicity. Race/ethnicity is constructed from self-reported ethnicity and race categories. First, Latino adults are distinguished from non-Latino adults. Among Latinos, Mexicans are distinguished from Other Latinos. For non- Latinos, race is categorized as White, Black, Asian, or Other race categories. Other races include Native Americans and Alaska natives, and other single or multiple races. For this study, Other race groups are excluded in the analyses.
Socioeconomic status (SES). SES is measured by two variables: educational attainment and family income-to-poverty ratio (IPR). Educational attainment was measured in the number of years completed and was coded into four dummy variables: less than high school, high school diploma or equivalent, some college, and bachelor’s degree or higher (reference category). IPR is a categorical variable based on family income and poverty thresholds. IPR was coded into six dummy variables indicating percentages of family income to poverty ratio: less than 100, 100 – 149, 150 – 199, 200 – 299, 300 – 399, and 400 percent or more (reference group).
The following sociodemographic variables are controlled in all analyses: age (in years), gender (1 = female, 0 = male), immigrant (1 = foreign born, 0 = U.S. born), marital status (married (reference group), cohabiting, widowed, divorced/separated, and never married dummy variables (1 = yes, 0 = no)), employment status (1= employed, 0 = not employed), housing ownership (1 = yes, 0 = no), length of residence in house/ apartment (less than one year to 3 years, 4 -10 years, and 10 years or more (reference group) dummy variables (1 = yes, 0 = no)), and residential location (1 = nonmetropolitan, 0 = metropolitan (reference group)). The following health-related variables are also controlled: weight status categories based on body mass index (BMI): underweight (BMI < 18.5 kg/m2), healthy weight (18.5 kg/ m2 ≤ BMI < 25 kg/m2) (reference group), overweight (25 kg/m2 ≤ BMI < 30 kg/m2), and obese (BMI ≥ 30 kg/m2) dummy variables (1 = yes, 0 = no), and smoking (three dummy variables indicating current smoker, former smoker, and never smoker (reference group). Descriptive statistics (mean and standard errors) for variables used by race/ethnicity are presented in Table 1.
| Variables | All (n=62,004) |
Mexican (n=4,478) |
Other Latino (n=3,399) | African American (n=6,684) | Asian (n=3,330) | White (n=44,113) |
|---|---|---|---|---|---|---|
| Self-rated health (1-5) | 3.65 (.007) | 3.57 (.02) | 3.65 (.02) | 3.50 (.02) | 3.83 (.02) | 3.68 (.01) |
| Race/Ethnicity | ||||||
| Mexican, % | 9.90 (.52) | |||||
| Other Latino, % | 6.70 (.34) | |||||
| African American, % | 11.67 (.42) | |||||
| Asian, % | 6.01 (.26) | |||||
| White, % | 65.53 (.76) | |||||
| Age (18-85) | 48.06 (.13) | 41.19 (.34) | 43.75 (.38) | 45.78 (.27) | 45.74 (.42) | 50.24 (.16) |
| Female, % | 51.09 (.24) | 51.00 (.87) | 51.53 (1.05) | 55.12 (.73) | 51.88 (.96) | 50.27 (.28) |
| Foreign born, % | 7.99 (.26) | 32.53 (1.03) | 25.94 (1.01) | 4.35 (.40) | 27.02 (1.03) | 1.37 (.07) |
| Educational Attainment | ||||||
| Less than high school, % | 10.80 (.27) | 32.43 (1.05) | 19.59 (1.05) | 12.43 (.64) | 8.61 (.78) | 6.56 (.19) |
| High school, % | 27.84 (.31) | 31.62 (.91) | 28.79 (.97) | 33.53 (.80) | 17.08 (.97) | 27.14 (.37) |
| Some college, % | 29.35 (.28) | 24.30 (.71) | 28.26 (.89) | 31.57 (.71) | 20.21 (.86) | 30.67 (.34) |
| College or higher, % | 31.94 (.41) | 11.65(.51) | 23.35 (.81) | 22.45 (.70) | 54.10 (1.30) | 35.63 (.47) |
| Income-to-poverty ratio | ||||||
| Less than 100%, % | 9.76 (.22) | 17.55 (1.01) | 16.39 (.83) | 17.92 (.68) | 8.76 (.60) | 6.56 (.18) |
| 100 – 149%, % | 8.89 (.17) | 16.39 (.83) | 13.61 (.67) | 13.92 (.56) | 8.39 (.63) | 6.44 (.16) |
| 150 – 199%, % | 8.91 (.16) | 14.12 (.54) | 11.79 (.66) | 11.44 (.46) | 7.72 (.57) | 7.49 (.16) |
| 200 – 299%, % | 16.60 (.20) | 21.40 (.70) | 19.26 (.74) | 19.12 (.61) | 15.12 (.76) | 15.30 (.22) |
| 300 – 399%, % | 13.65 (.17) | 11.56 (.52) | 12.67 (.63) | 12.78 (.49) | 12.04 (.63) | 14.37 (.20) |
| 400% or greater, % | 42.07 (.44) | 19.05 (.85) | 26.28 (.89) | 24.83 (.82) | 47.97 (1.35) | 49.84 (.48) |
| Marital status | ||||||
| Married, % | 52.50 (.29) | 43.34 (.86) | 48.68 (1.00) | 33.12 (.76) | 62.89 (.93) | 56.16 (.33) |
| Cohabiting, % | 8.47 (.15) | 11.24 (.56) | 10.65 (.65) | 8.42 (.18) | 3.78 (.36) | 8.42 (.18) |
| Widowed, % | 5.89 (.10) | 3.31 (.28) | 3.61 (.32) | 6.43 (.30) | 4.12 (.35) | 6.58 (.12) |
| Divorced/Separated, % | 10.16 (.13) | 9.03 (.44) | 12.21 (.53) | 13.79 (.41) | 5.07 (.42) | 9.94 (.15) |
| Never married, % | 22.87 (.26) | 28.08 (.74) | 24.85 (.91) | 39.47 (.73) | 24.13 (.85) | 18.90 (.28) |
| Employed, % | 62.94 (.29) | 68.60 (.90) | 66.71 (1.02) | 60.12 (.81) | 64.90 (.99) | 62.02 (.34) |
| Homeowner, % | 68.47 (.39) | 57.63 (1.21) | 50.34 (1.30) | 47.52 (.99) | 64.82 (1.10) | 76.01 (.35) |
| Length time of residence | ||||||
| Less than 3 years | 34.59 (.33) | 36.42 (.94) | 43.08 (1.15) | 40.91 (.86) | 39.25 (1.18) | 31.89 (.34) |
| 4 -10 years | 25.07 (.22) | 28.62 (.75) | 27.38 (.88) | 24.98 (.65) | 29.14 (.97) | 23.95 (.24) |
| 11 years or more | 40.28 (.33) | 34.96 (1.07) | 29.54 (1.09) | 34.11 (.88) | 31.60 (1.09) | 44.15 (.37) |
| Weight status | ||||||
| Underweight, % | 1.59 (.06) | .93 (.14) | 1.22 (.20) | 1.02 (.13) | 3.59 (.30) | 1.65 (.07) |
| Healthy weight, % | 31.62 (.27) | 22.96 (.75) | 28.14 (.90) | 23.10 (.64) | 54.32 (1.02) | 32.64 (.31) |
| Overweight, % | 34.00 (.22) | 36.76 (.75) | 36.64 (.96) | 31.86 (.69) | 31.53 (.94) | 33.92 (.25) |
| Obese, % | 32.84 (.28) | 39.35 (.87) | 34.00 (.96) | 44.01 (.74) | 10.56 (.66) | 31.79 (.32) |
| Current smoker, % | 12.50 (.19) | 7.70 (.43) | 8.491 (.50) | 13.79 (.54) | 6.94 (.55) | 13.91 (.23) |
| Former smoker, % | 22.97 (.23) | 14.80 (.53) | 16.18 (.65) | 13.48 (.46) | 12.26 (.57) | 27.55 (.28) |
| Never smoker, % | 64.79 (.32) | 77.66 (.66) | 75.95 (.70) | 73.11 (.67) | 81.14 (.79) | 58.59 (.37) |
| No health insurance, % | 10.41 (.25) | 29.34 (1.10) | 20.51 (.96) | 11.74 (.56) | 6.14 (.54) | 6.68 (.19) |
| Nonmetropolitan, % | 13.75 (.54) | 7.46 (1.94) | 2.63 (.39) | 8.69 (1.29) | 2.23 (.54) | 17.78 (.76) |
Analytical Plan
The analysis proceeds in four steps. First, descriptive statistics of health differences by race/ethnicity are presented. Second, descriptive statistics of health differences by different dimensions of SES are presented. Third, regression models of health status are estimated to highlight the relative and combined influences of race/ethnicity, SES, and control variables. Finally, interaction terms between racial and ethnicity and SES are added to the final model to better estimate racial/ethnic differences in health that may be attributed to racial/ethnic differences in SES. To account for the NHIS sampling design, all analyses are weighted using the final annual sampling weights (WTFA_A). Both weights were divided by 3 to produce correct population estimates in the pooled analysis. Point estimates and estimates of their variances were calculated using STATA 15.1 software to account for the complex sampling design of NHIS, considering stratum and sampling unit identifiers. The Taylor series linearization was chosen for variance estimation.
Results
Descriptive Analysis
Figure 1 displays mean self-rated health by race/ethnicity. The results show that Mexicans and African Americans have on average lower health than Whites whereas Asians exhibit higher average health than Whites. There was no significant difference between the average health of Other Latinos and that of Whites (Figure 1). Figure 2 displays self-rated health by educational attainment. As expected, education is positively associated with self-rated health. The mean health among college-educated adults is significantly higher than the mean health among adults with less than a high school, high school or equivalent, and some college education, respectively (figure 2). Figure 3 displays self-rated health by family income-to-poverty ratio (IPR). As expected also, income-to-poverty ratio is positively associated with self-rated health. Adults in poverty (< 100% IPR) have significantly lower mean health than those at the end of the income spectrum (≥400% IPR) (figure 3). Table 1 presents summary statistics for all variables in the analysis by race/ethnicity.
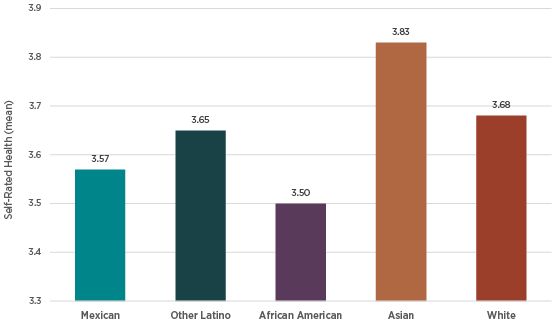
Figure 1. Self-Rated Health by Race/Ethnicity (2019-2021) [h4]
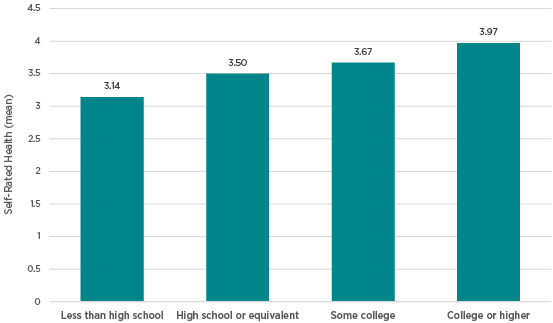
Figure 2. Self-Rated Health by Educational Attainment (2019-2021)
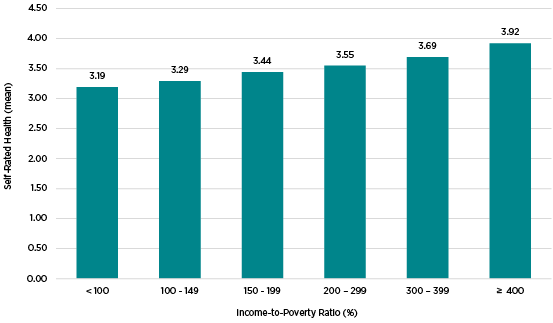
Figure 3. Self-Rated Health by Family Income-to-Poverty Ratio (IPR) (2019-2021)
| Model 1 | Model 2 | Model 3 | Model 4 | Model 5 | |
|---|---|---|---|---|---|
| Race/Ethnicity (0 = white) | |||||
| Mexican | .810*** | 1.198*** | 1.370*** | .873*** | .688*** |
| Other Latino | .957 | 1.172*** | 1.336*** | .963 | .928 |
| African American | .726*** | .834*** | .970 | .889*** | .745*** |
| Asian | 1.260*** | 1.156*** | 1.236*** | .787*** | .736*** |
| Educational Attainment (0 = college graduate) | |||||
| Less than high school | .224*** | .333*** | .471*** | .461*** | |
| High school | .444*** | .562*** | .689*** | .665*** | |
| Some college | .598*** | .698*** | .787*** | .779*** | |
| Income-to-poverty ratio (IPR) (0 = 400% or greater) | |||||
| Less than 100% | .395*** | .463*** | .435*** | ||
| 100 - 149% | .457*** | .534*** | .490*** | ||
| 150 - 199% | .564*** | .661*** | .647*** | ||
| 200 - 299% | .632*** | .694*** | .681*** | ||
| 300 - 399% | .748*** | .800*** | .785*** | ||
| Control Variables | |||||
| Age (in years) | .974*** | .974*** | |||
| Female | .997 | .999 | |||
| Foreign born | 1.122** | 1.109** | |||
| Marital status (0 = married) | |||||
| Cohabiting | .818*** | .830*** | |||
| Widowed | 1.056 | 1.060 | |||
| Divorced/Separated | .866*** | .871*** | |||
| Never married | .919** | .921** | |||
| Employed | 1.570*** | 1.569*** | |||
| Homeowner | 1.127*** | 1.130*** | |||
| Time of residence (0 = > 10 years) | |||||
| Less than 3 years | .922*** | .922*** | |||
| 4-10 years | .923*** | .923*** | |||
| Weight status (0 = healthy weight) | |||||
| Underweight | .635*** | .631*** | |||
| Overweight | .726*** | .728*** | |||
| Obese | .346*** | .346*** | |||
| Smoking (0 = never smoker) | |||||
| Current smoker | .482*** | .486*** | |||
| Former smoker | .720*** | .721*** | |||
| Nonmetropolitan | .912*** | .918*** | |||
| Interaction terms | |||||
| Mexican x less than high school | 1.366** | ||||
| Mexican x high school | 1.419** | ||||
| Mexican x some college | 1.259* | ||||
| Other Latino x high school | 1.226* | ||||
| African American x less than 100% IPR | 1.283* | ||||
| African American x 100 - 149% IPR | 1.556*** | ||||
| African American x 150 – 199% IPR | 1.229* | ||||
| African American x 200 – 299% IPR | 1.225* | ||||
| African American x 300 – 399% IPR | 1.260** | ||||
| Asian x less than 100% IPR | 1.639*** | ||||
| Asian x 100 - 149% IPR | 1.398** | ||||
| Intercept 1 | -3.454 | -4.036 | -4.210 | -6.089 | -6.118 |
| Intercept 2 | -1.861 | -2.409 | -2.566 | -4.355 | -4.383 |
| Intercept 3 | -.387 | -.870 | -.997 | -2.601 | -2.628 |
| Intercept 4 | 1.091 | .669 | .665 | -.836 | -.861 |
| Model fit/F test | F(4,602)=46.05*** | F(7,599)=378.44*** | F(12,594)=278.87*** | F(29,576)=426.68*** | F(40,565)=308.73*** |
Multivariate Analysis
Table 2 shows odds ratios for self-rated health by race/ethnicity from ordered logistic regression models. The results in model 1 (table 2) show that there are significant racial/ethnic differences in self-rated health. The odds of reporting excellent health decreases 19 percent (i.e., [(1 - .810) x 100] more for Mexicans and 27 percent more for African Americans than for Whites, respectively. In contrast, the odds of reporting excellent health increases 26 percent (i.e., [(1.26 – 1) x 100] more for Asians than for Whites. The main effects of race/ethnicity in subsequent models in table 2 reflect the baseline model of the self-rated health differences between Latinos, African Americans, and Asians and Whites. Other covariates in table 2 can be interpreted in the same way that conventional ordered logistic regression models are interpreted. Exponentiation of the values for intercept 1 – 4 represents the odds of reporting different levels of health status for the reference group.
Next, model 2 adds educational attainment as one of the covariates to determine how education contributes to differences in self-rated health by race/ethnicity. A comparison of models 1 and 2 shows that controlling for respondent’s education results in substantial change in self-rated health by race ethnicity. These results suggest that racial/ethnic differences in education partially explain differences in self-rated health between Latino,
African American, and Asian racial/ethnic groups and Whites. Specifically, the odds ratios of excellent health for Mexicans increases more by 20 percent, 17 percent for Other Latinos, and 16 percent more for Asians than for Whites, respectively, net of the effects of educational attainment on self-rated health. In contrast, the odds of excellent health for African American decreases 17 percent more than Whites, net of the effects of educational attainment on self-rated health. The results in model 2 also show that the odds ratios of excellent health for adults with less than a high school education decreases 78 percent more, 56 percent more for adults with a high school diploma or equivalent, and 40 percent more for adults with some college education than for adults with a college degree or higher, respectively.
Model 3 (table 2) adds another SES measure: the income-topoverty ratio to see if it too explains racial/ethnic differences in health. The results suggest that adding income-to-poverty
ratio results in substantially change in self-rated health by race/ethnicity. The odds ratios of excellent health increases 37 percent more for Mexicans, 34 percent more for Other Latinos, and 24 percent more for Asians than Whites, respectively, net of the effects of both educational attainment and income-topoverty ratio on health. The odds of excellent health for African Americans further decreases and become not significantly different from those of Whites once the effects of education and income-to-poverty ratio are taken into consideration in model 3 of Table 2. As expected, the results in model 3 show that the odds ratios of excellent health incrementally decrease as incometo-poverty ratio increases, i.e., as one moves from poverty and lower class to middle and then upper classes. More specifically, the odds of excellent health decreases 60 percent more for adults in poverty (IPR < 100%), 54 percent more for adults with IPR between 100 – 149 percent (i.e., those near poverty), 44 percent for those with IPR between 150 and 199 percent, 37 percent more for IPR between 200 – 299 percent, and 25 percent more for adults with 300 – 399 percent than adults with IPR greater or equal to 400 percent, respectively, net of the effects of race/ethnicity and educational attainment. Educational attainment
also remains negatively associated with self-rated health.
Estimated effects of all the other covariates, displayed in model 4 (Table 2), are in the expected direction. Specifically, the odds of reporting excellent health decline with age, and they are smaller for cohabiting, divorced/separated, and never married compared to married adults. They are also lower for adults who had resided in their homes/apartments for less than 10 years compared to those who resided in their homes more than ten years. They are also lower for adults who were underweight, overweight, and obese compared to those with a healthy weight status. They are also lower for current smokers and former smokers compared to never smokers, and those residing in nonmetropolitan areas compared to those in metropolitan areas. In contrast, the odds of reporting excellent health were higher for adults currently employed compared to those not employed and not working, and higher for homeowners compared to renters.
Race/Ethnicity and SES Variations in Self-Rated Health [h4]
Model 5 (Table 2) adds interaction terms between race/ethnicity and education, and between race/ethnicity and income-to-poverty ratio. The odds of reporting excellent health remain smaller for Mexicans, African Americans, and Asians than those of Whites, net of the effects of other covariates in the model. The odds of reporting excellent health remain significantly lower for respondents with lower levels of education and lower
income-to-poverty ratios. Only significant interaction terms (p < .05) were retained in the final model. To illustrate the results in model 5, figure 4 displays the estimated predicted probability of reporting excellent health by educational attainment and race/ethnicity, whereas figure 5 displays the estimated predicted probability of reporting excellent health by income-to-poverty ratio and race/ethnicity. The results show that the probability of reporting excellent health increased rapidly by education levels among whites, followed by other Latinos, African Americans, and Asians while it increased at a fairly rapid and almost a constant rate among Mexicans, leading to an increasing gap in self-rated health between Mexicans and Whites. The probability of reporting excellent health for African Americans and Asians significantly increased as education increases. Nonetheless, gaps in self-rated health between African Americans and Whites, and between Asians and Whites slightly increase as education levels increase, leading to larger gaps for those with college education or more than those with less than high school education (Figure 5).

Figure 4. Self-Rated Health by Educational Attainment (2019-2021) [h4]
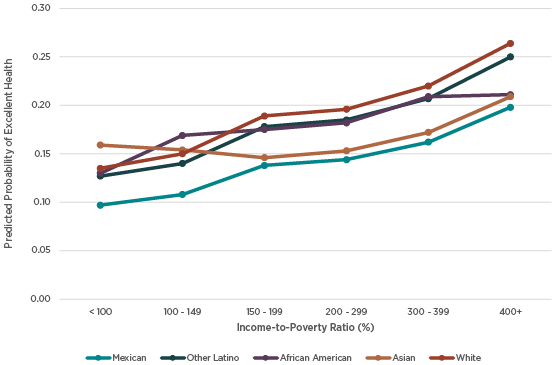
Figure 5. Self-Rated Health by Family Income-to-Poverty Ratio (IPR) (2019-2021) [h4]
Figure 5 displays the estimated predicted probability of reporting excellent health by income-to-poverty ratio and race/ethnicity. Mexicans in poverty (< 100% IPR) are less likely than Whites to report being in excellent health. However, the predicted probability of reporting excellent health increases at a slower rate for Mexicans relative to Whites as income-to-poverty ratio increases, leading to larger gaps in self-rated health at the
higher end of the income spectrum (≥ 400% IPR). The predicted probability of reporting excellent health for Other Latinos increases significantly as income-to-poverty ratio increases, but it increases at the same pace relative to whites, leading to no significant differences at the higher end of the income spectrum. The predicted probability of reporting excellent health for African Americans also increases as income-to-poverty increases. However, it increases almost at the same pace relative to whites, except from poverty to near-poverty (100 – 149% IPR) where it increases at a slightly higher rate than Whites and then at the end of income spectrum, where it dramatically decreases, leading to a larger gap in self-rated health relative to Whites. The predicted probability of excellent health for Asians is higher than that of Whites at poverty level, but it decreases thereafter
up to a 150 – 199% IPR and then increases as income-to-poverty increases but remains lower than that of whites at the end of the income spectrum.
Discussion
The analysis in this paper based on the pooled data from NHIS 2019 – 2021, shows that there are significant differences in selfrated health by race/ethnicity. The odds of reporting excellent health are significantly lower for Mexicans and African Americans than they are for Whites. In contrast, the odds of reporting excellent health are significantly higher for Asians than Whites. As expected, the odds of reporting excellent health increase as SES increases both in terms of education and family income social classes. One important conclusion is that SES accounts for a large proportion of racial/ethnic disparities of self-health, but in the end racial/ethnic disparities remain. The odds of reporting excellent health significantly increase more for Mexicans, Other Latinos, and Asians than Whites, whereas the odds of excellent health for African Americans decreases more than Whites once education is accounted for in explaining self-rated health. Similarly, the odds of reporting excellent health significantly increase more for Mexicans, Other Latinos, and Asians than Whites, whereas the odds of excellent health for African Americans decreases to being non-significant as compared to those of Whites once family income-to-poverty ratio is factored in explaining self-rated health. The contribution of SES to racial/ethnic self-rated health gap remains substantial and statistically significant across subsequent models that control for other sociodemographic characteristics such as age, gender, immigrant status, marital status, employment status, home ownership, length of residence, and health indicators such as weight status and smoking, and nonmetropolitan/metropolitan residence. In the end, the odds of reporting excellent health remain smaller for Mexicans, African Americans, and Asians than those of Whites, net of the effects of SES and those other covariates.
The other conclusion for this study is that accounting for SES and its interaction with race/ethnicity provide further explanation for persistent racial/ethnic disparities in self-rated health. The probability of reporting excellent health increases rapidly by education levels among whites, followed by other Latinos, African Americans, and Asians, but it increases at a fairly rapid pace and then at almost a constant rate among Mexicans, leading to
a large gap in self-rated health between Mexicans and Whites for those with college education or higher. Gaps in self-rated health between African Americans and Whites and between Asians and Whites slightly increase as education levels increase but remain larger for those with higher education than those with lower education. Gaps of reporting excellent health persist across family income levels and become significantly larger
between Mexicans and Whites and between African Americans and Whites at the higher end of the income spectrum. Gaps of reporting excellent health between Asians and Whites vary by family income levels with Asians reporting higher probability of excellent health than Whites at poverty and lower income levels, but lower than that of Whites at the end of the income spectrum.
These findings are consistent with results from studies that show that race/ethnicity and SES are interlinked and both influence conditions of life that have health consequences. Although SES accounts for a large part of racial/ethnic differences in health, racial/ethnic disparities in health persist (Kayitsinga and Martinez, 2008; Adler and Rehkopf, 2008; Williams, 1999; Williams, Priest, and Anderson, 2016). In summary, individuals with higher SES are likely to report better health than their lower SES counterparts. This study further shows that SES accounts for a large part of racial/ethnic differences in health, but racial/ethnic health gaps remain and become larger at higher SES levels for Mexicans, African Americans, and Asians relative to Whites.
This study is limited in focusing on subjective health. Future studies on racial/ethnic and SES health disparities need to look at other health outcomes such as mortality rates, chronic health conditions, mental health, and activity limitations. This study is also limited in focusing only to individual and family characteristics’ effects on health. Future research should link NHIS data to other census data to account for neighborhood/community residential contexts and their potential effects on racial/ethnic health disparities.
References
Adler, N. E., & Rehkopf, D. H. (2008). US disparities in health: descriptions, causes, and mechanisms. Annual review of public health, 29, 235.
Arias, E., & Xu, J. (2022). United States Life Tables, 2019. National Vital Statistics Reports:From the Centers for Disease Control and Prevention, National Center for Health Statistics, National Vital Statistics System,
70(19), 1-59.
Braveman, P. A., Cubbin, C., Egerter, S., Williams, D. R., & Pamuk, E. (2010). Socioeconomic disparities in health in the United States: what the patterns tell us. American journal of public health, 100(S1), S186-S196.
Cho, Y., Frisbie, W. P., Hummer, R. A., & Rogers, R. G. (2004). Nativity, duration of residence, and the health of Hispanic adults in the United States. International Migration Review, 38(1), 184-211.
Cockerham, W. C. (2005). Health lifestyle theory and the convergence of agency and structure. Journal of health and social behavior, 46(1), 51-67.
Collins, J. W., Papacek, E., Schulte, N. F., & Drolet, A. (2001). Differing post neonatal mortality rates of Mexican-American infants with United-States-born and Mexico-born mothers in Chicago. Ethnicity & Disease,
11(4), 606-613.
Heron, M. P. (2021). Deaths: leading causes for 2018. National Vital Statistics Reports: From the Centers for Disease Control and Prevention, National Center for Health Statistics, National Vital Statistics System,
70(4), 1-115.
Hummer, R. A., Powers, D. A., Pullum, S. G., Gossman, G. L., & Frisbie, W. P. (2007). Paradox found (again): infant mortality among the Mexican origin population in the United States. Demography, 44(3), 441-457.
Idler, E. L., & Benyamini, Y. (1997). Self-rated health and mortality: a review of twenty-seven community studies. Journal of health and social behavior, 21-37.
Kayitsinga, J., & Martinez, R. (2008). The Impact of Race/Ethnicity, Household Structure, and Socioeconomic Status on Health Status in the Midwest.
Lynch, J., & Kaplan, G. (2000). Socioeconomic position (Vol. 2000, pp. 13-35). Social epidemiology. New York: Oxford University Press.
Markides, K. S., & Eschbach, K. (2005). Aging, migration, and mortality: current status of research on the Hispanic paradox. The Journals of Gerontology Series B: Psychological Sciences and Social Sciences, 60 (Special_Issue_2), S68-S75.
Murphy, S. L., Xu, J., Kochanek, K. D., Arias, E., & Tejada-Vera, B. (2021). Deaths: final data for 2018. National Center for Health Statistics (U.S.). Division of Vital Statistics. National vital statistics reports, 69(13): 1-
Robert, S. A., & House, J. S. (2000). Socioeconomic inequalities in health: Integrating individual-, community-, and societal-level theory and research. The handbook of social studies in health and medicine, 115, 35.
Singh, G. K., & Hiatt, R. A. (2006). Trends and disparities in socioeconomic and behavioral characteristics, life expectancy, and cause-specific mortality of native-born and foreign-born populations in the United States, 1979–2003. International journal of epidemiology, 35(4), 903-919.
Snead, M. C., & Cockerham, W. C. (2002). Health lifestyles and social class in the deep South. In Social inequalities, health and health care delivery. Emerald Group Publishing Limited.
Williams, D. R., & Collins, C. (1995). US socioeconomic and racial differences in health: patterns and explanations. Annual review of sociology, 349-386.
Williams, D. R. (1999). Race, socioeconomic status, and health the added effects of racism and discrimination. Annals of the New York Academy of Sciences, 896(1), 173-188.
Williams, D. R., Mohammed, S. A., Leavell, J., & Collins, C. (2010). Race, socioeconomic status, and health: complexities, ongoing challenges, and research opportunities. Annals of the New York Academy of Sciences,
1186(1), 69-101.
Williams, D. R., & Sternthal, M. (2010). Understanding racial-ethnic disparities in health: sociological contributions. Journal of health and social behavior, 51(1_suppl), S15-S27.
Williams, D. R., Priest, N., & Anderson, N. B. (2016). Understanding associations among race, socioeconomic status, and health: Patterns and prospects. Health Psychology, 35(4), 407.