
Latinos and the United States Banking System
Introduction
For more than forty years the number of Latinos living in the United States has been increasing, reaching 19% of the U.S. population according to the 2020 Census, and it is expected to reach 25% by 2030. Their economic and financial influence within the U.S. economy is usually measured by their purchasing power, which attained over $1.7 trillion per year in 2021. According to the U.S. Small Business Administration, “There are 4.65 million Latino-owned businesses currently operating in the country making them the fastest growing segment of US small businesses, up 34% in the last 10 years” (SBA, 2021: para. 2). Latino-owned businesses create 3.4 million jobs and generate over $700 billion in sales per year (Arora, 2020).
Despite these impressive gains, Latino households and businesses continue facing challenges participating in the formal financial system, especially with gaining total access to banks and the services they provide. For more than a decade, the U.S. government through the Federal Deposit Insurance Corporation (FDIC) and the Federal Reserve System (FRS) has been asking banks to foster the diversification and inclusion of their customers, especially Latinos and Blacks as they have the lowest rates.
Unbanked and Underbanked Households
Studies by these Federal organizations have identified three clearly distinct categories in terms of the relationships between households and the banking system: 1) unbanked, 2) underbanked, and 3) totally banked. Unbanked households are those with no relationship with banks and that do not have accounts with banks. Their financial transactions tend to involve cashing checks, buying money orders to pay bills, making domestic and international transfers, among others, and are conducted outside the banking system. Underbanked households usually have some type of relationships with banks such as having a checking or savings account, but at the same time they continue using the services of the Alternative Financial System (AFS) for most of their financial transactions. These services are the same used by the unbanked households. Finally, totally banked households perform all their financial transactions within the banking system.
According to several surveys conducted by the FDIC and FRS, minority groups with low participation rates in the banking system have identified several reasons for not having a bank account. Among those that they cite as the most important are: a) not having enough money to keep in account, b) not trusting banks, c) avoiding banks gives more privacy, d) account fees that are too high and unpredictable, e) former bank account problems, and f) lack of preferred products or services by banks. Clearly, banks in this country need to make a series of adjustments to the way they perform their operations and utilize more proactive approaches to facilitate the incorporation of Latinos and Blacks into their customer base.
Table 1 shows the percentage and number of U.S. households that were unbanked and underbanked from 2009 to 2019. Approximately 7.7% of U.S. households, equivalent to 9.0 million households, were unbanked in 2009. This number increased slightly in 2011 to 8.2%, or 10.0 million households. We assume the increases were due to the Great Recession of 2007-2009, when many people lost their jobs and were unable to maintain the minimum balances in their accounts required by banks. Since 2011, the percentage and number of unbanked households declined from 8.2% in 2011 to 5.4% in 2019, reflecting a decline of 2.8 percentage points and a reduction of 2.9 million unbanked households. During this period, the number of the unbanked adult population declined by 5.7 million from 17 million in 2009 to 11.3 million in 2019, which represents a 33.5% drop in the number of unbanked adults.
|
Year |
Description |
Unbanked |
Underbanked |
Total |
|||
|---|---|---|---|---|---|---|---|
|
Pct. |
Number (Millions) |
Pct. |
Number (Millions) |
Pct. |
Number (Millions) |
||
|
2009 |
Households |
7.7% |
9.0 |
17.9% |
21.0 |
25.6% |
30.0 |
|
Adult Population |
17.0 million |
43.0 million |
60.0 million |
||||
|
2011 |
Households |
8.2% |
10.0 |
20.1% |
24.0 |
28.3% |
34.0 |
|
Adult Population |
17.0 million |
51.0 million |
68.0 million |
||||
|
2013 |
Households |
7.7% |
9.6 |
20.0% |
24.8 |
27.7 |
34.4 |
|
Adult Population |
16.7 million |
50.9 million |
67.6 million |
||||
|
2015 |
Households |
7.0% |
9.0 |
19.9% |
24.5 |
26.9% |
33.5 |
|
Adult Population |
15.6 million |
51.1 million |
66.7 million |
||||
|
2017 |
Households |
6.5% |
8.4 |
18.7% |
24.2 |
25.2% |
32.6 |
|
Adult Population |
14.1 million |
48.9 million |
63.0 million |
||||
|
2019 |
Households |
5.4% |
7.1 |
16.0% |
21.0 |
21.4% |
26.4 |
|
Adult Population |
11.3 million* |
42.7 million* |
54.0 million |
||||
Source: 2009 to 2019 FDIC National Survey of Unbanked and underbanked Households.
*Not published by FDIC, estimated by the author.
The analysis of underbanked households shows similar trends as for unbanked households. Approximately, 17.9% were underbanked in 2009, representing 21 million households. This figure increased to 20.1% in 2011 for the same reasons provided above for unbanked households. Since then the percentage of underbanked households steadily declined to 16% in 2019, a decline of 4.0% points. From 2013 to 2017, the number of underbanked households remained relatively constant at around 24.4 million. In 2019, the number of underbanked households was at 21.0 million, similar to the figure in 2009, but 3.8 million less than in 2013.
Table 2 shows the percentages of unbanked, underbanked, and banked households by race and ethnic group from 2009 to 2019. During this period, Blacks had the highest figures for unbanked and underbanked households, which results in having the lowest figures for totally banked households among all the racial and ethnic groups. Only 46.7% of Black households were totally banked in 2009, but that figure declined slightly to 44.7% by 2011, then increased steadily to 54.2% by 2019, reflecting an increase of 9.5% points.
|
Year |
Description |
Blacks (%) |
Latinos (%) |
American Indian/ Alaskan (%) |
Asians (%) |
Whites (%) |
|---|---|---|---|---|---|---|
|
2009 |
Unbanked |
21.7 |
19.3 |
15.6 |
3.5 |
3.3 |
|
Underbanked |
31.6 |
24.0 |
28.9 |
7.2 |
14.9 |
|
|
Sub-Total |
53.3 |
43.3 |
44.5 |
10.7 |
18.2 |
|
|
Banked |
46.7 |
56.7 |
55.5 |
89.3 |
81.8 |
|
|
Total |
100.0 |
100.0 |
100.0 |
100.0 |
100.0 |
|
|
2011 |
Unbanked |
21.4 |
20.1 |
14.5 |
2.7 |
4.0 |
|
Underbanked |
33.9 |
28.6 |
26.8 |
16.6 |
16.1 |
|
|
Sub-Total |
55.3 |
48.7 |
41.3 |
19.3 |
20.1 |
|
|
Banked |
44.7 |
51.3 |
58.7 |
80.7 |
79.9 |
|
|
Total |
100.0 |
100.0 |
100.0 |
100.0 |
100.0 |
|
|
2013 |
Unbanked |
20.5 |
17.9 |
16.9 |
2.2 |
3.6 |
|
Underbanked |
33.1 |
28.5 |
25.5 |
17.9 |
15.9 |
|
|
Sub-Total |
53.6 |
46.4 |
42.4 |
20.1 |
19.5 |
|
|
Banked |
46.4 |
53.6 |
57.6 |
79.9 |
80.5 |
|
|
Total |
100.0 |
100.0 |
100.0 |
100.0 |
100.0 |
|
|
2015 |
Unbanked |
18.2 |
16.2 |
11.1 |
4.0 |
3.1 |
|
Underbanked |
31.1 |
29.3 |
27.5 |
21.0 |
15.6 |
|
|
Sub-Total |
49.3 |
45.5 |
38.6 |
25.0 |
18.7 |
|
|
Banked |
50.7 |
54.5 |
61.4 |
75.0 |
81.3 |
|
|
Total |
100.0 |
100.0 |
100.0 |
100.0 |
100.0 |
|
|
2017 |
Unbanked |
16.9 |
14.0 |
12.8 |
2.5 |
3.0 |
|
Underbanked |
30.4 |
28.9 |
28.0 |
17.5 |
14.1 |
|
|
Sub-Total |
47.3 |
42.9 |
40.8 |
20.0 |
17.1 |
|
|
Banked |
52.7 |
57.1 |
59.2 |
80.0 |
82.9 |
|
|
Total |
100.0 |
100.0 |
100.0 |
100.0 |
100.0 |
|
|
2019 |
Unbanked |
13.8 |
12.2 |
16.3 |
1.7 |
2.5 |
|
Underbanked** |
32.0 |
22.0 |
* |
* |
11.0 |
|
|
Sub-Total |
45.8 |
34.2 |
16.3 |
1.7 |
13.5 |
|
|
Banked |
54.2 |
65.8 |
|
|
86.5 |
|
|
Total |
100.0 |
100.0 |
100.0 |
100.0 |
100.0 |
Source: 2009 to 2019 FDIC National Survey of Unbanked and underbanked Households.
Board of Governors of the Federal Reserve System, Consumers and Mobile Financial Services 2016.
*Not reported by FDIC.
**Reported by FRS.
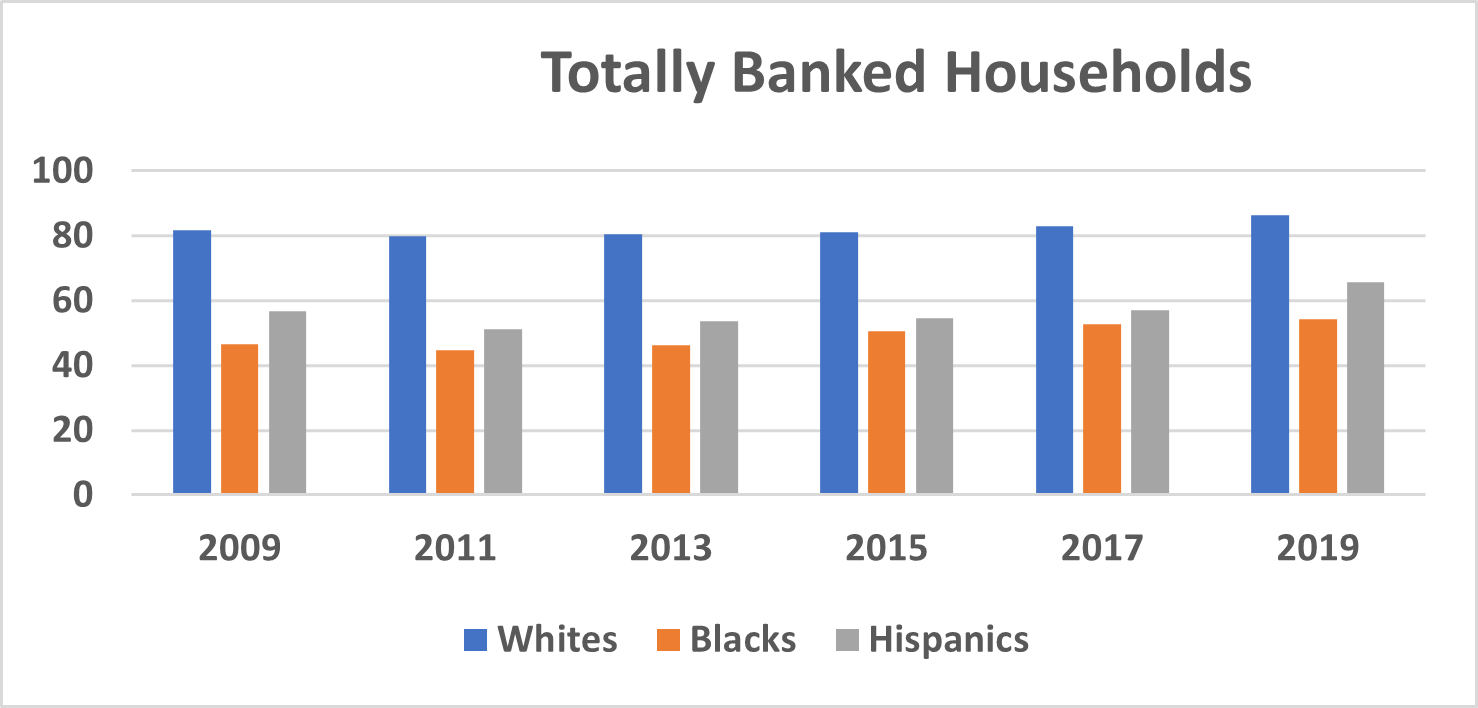
The percentages of Hispanic households show a similar pattern as that for Black households, declining from 56.7% in 2009 to 51.3% in 2011, and then gradually increasing from 53.6% in 2013 to 65.8% in 2019, reflecting an increase of 12.2% points in totally banked Hispanic households. Whites have the highest percent of totally banked households of the three groups and have patterns similar to those observed for Black and Hispanic households. Their percentages declined from 81.8% in 2009 to 79.9% in 2011, and since 2013 increased steadily from 80.5% to 86.5% in 2019, reflecting an increase of 6.0% points in 6 years and yielding a rate higher than that in 2009. In summary, Hispanic households show the highest increase in totally banked households of the three groups with a net increase of 12.2% in 6 years, but they were still 20.7 percentage points behind White households in 2019.
Figure 1 shows the increases in totally banked households by race and ethnicity from 2009 to 2019. We can observe gradual increases for the groups, especially for Hispanic households, which have the second highest percentages of unbanked and underbanked households resulting in the second lowest percentage of fully banked households. It also shows the large gaps that persist between Whites and Latinos and Blacks.
Figure 1. Increases in Totally Banked Households by Race and Ethnicity, 2009-2019 (Percent)
There are many reasons why minority groups have the lowest percentages of totally banked households. Language barriers are perhaps among the most important, while others are the lack of trust these groups have in banks, especially due to previous bad experiences, banks’ physical facilities, and the minimum balances required to maintain accounts, among others.
To overcome these cultural barriers, minority groups and especially Latinos have been using banking products based on new technology offered by banks. In particular, online and mobile banking have allowed increased access to banking products and services by everyone, but especially by minority groups. According to Frankenfield (2020), “Online banking offers customers almost every service traditionally available through a local branch including deposits, transfers, and online bill payments. Virtually every banking institution has some form of online banking, available both on desktop versions and through mobile apps” (para. 2). Chen (2020) defines mobile banking as “the act of making financial transactions on a mobile device (cell phone, tablet, etc.). This activity can be as simple as a bank sending fraud or usage activity to a client’s cell phone or as complex as a client paying bills or sending money abroad” (para. 1). Chen identifies as disadvantages of mobile banking “security concerns and a limited range of capabilities when compared to banking in person or on a computer” (para. 1), but the ability to bank from anywhere at any time removes barriers to access faced by segments of minority groups.
Table 3 shows the use of online and mobile banking for households by racial and ethnic group. Close to one-third of all banked households were using online banking from 2013 to 2017, but these figures dropped by almost 14 points by 2019 when a shift occurred toward the use of mobile banking to access bank services. In 2013, only 5.7% of U.S. households were using mobile banking, but this figure increased steadily by 2019, reaching 34.0% and reflecting an increase of 28.3 percentage points in just six years.
|
Year |
Race and Ethnicity |
Online Banking [%] |
Mobile Banking [%] |
|---|---|---|---|
|
2013 |
All |
32.9 |
5.7 |
|
White |
35.8 |
5.0 |
|
|
Black |
21.3 |
7.8 |
|
|
Hispanic |
23.0 |
8.3 |
|
|
2015 |
All |
36.9 |
9.5 |
|
White |
40.0 |
8.6 |
|
|
Black |
25.1 |
11.3 |
|
|
Hispanic |
27.2 |
12.6 |
|
|
2017 |
All |
36.0 |
15.6 |
|
White |
39.2 |
14.5 |
|
|
Black |
24.0 |
17.2 |
|
|
Hispanic |
25.7 |
19.2 |
|
|
2019 |
All |
22.8 |
34.0 |
|
White |
26.7 |
31.4 |
|
|
Black |
12.0 |
37.2 |
|
|
Hispanic |
11.1 |
41.3 |
Source: 2013 to 2019 FDIC National Survey of Unbanked and underbanked Households.
Of interest, the use of mobile banking by minority groups and especially Latinos was higher than their White counterparts during the same period. In 2013, the percentage of Latinos who reported using mobile banking was 8.3%, which was 3.3 percentage points higher than that for Whites. In 2015, the difference was 4.0%, and in 2017 and 2019 the gaps were 4.7% and 9.9%, respectively. As shown in Table 3, Hispanic households had the highest percentage use of mobile banking among all considered groups.
In summary, Hispanic households have high unbanked and underbanked rates, which result in low totally banked rates. Only Black households have higher rates for unbanked and underbanked and the lowest for totally banked rates. Comparing these rates with the rates of mobile banking use by the same groups we see that Hispanic households have the highest rates for the use of mobile banking, which should prove very interesting and useful to government agencies and banks as they seek to attract more minorities and diversify their customer base in the context of designing new policies and developing new technology-based products.
Conclusion
The landscape of the U.S. banking system has experienced immense changes over the last decade. On the one hand, there has been enormous pressure by government agencies such as the FDIC and FRS to promote the inclusion of minority groups and the diversification of their customer base. On the other hand, there are many factors that make it very difficult for banks to comply with these pressures, including high banking fees, minimum account balances and, importantly, the low levels of trust that minority groups have for banks.
Banks have been working hard to develop special products aimed toward minorities, implementing more flexible policies and requirements, and hiring bilingual staff to facilitate communication with these groups. These are some of the changes that have been made to attract minorities. In the last decades, the development of new technologies such as computer networks, smartphones, and technology-based bank products have facilitated access to banking services to ethno-racial minorities that in the past had difficulties accessing bank accounts and products.
Ethno-racial minority groups, especially Latinos, have increased their rates of fully banked households that allow them to have access not only to their bank accounts and services such as credit, which occurs on more favorable terms than the ones they were obtaining in the alternative financial services (AFS) system. Clearly some progress has been made for the inclusion and diversification of customer bases of banks, but there is still a long way to go to achieve parity in fully banked rates with those of White households.
References
Arora, Rohit (2020), “The $700 billion Hispanic Business market in the U.S. is now at the tipping point,” CNBC Small Business Playbook, Retrieved from https://www.cnbc.com/2020/10/11/700-billion-dollar-hispanic-business-market-at-tipping-point.html.
Chen, James (2020), “Mobile Banking,” Investopedia, Retrieved from
https://www.investopedia.com/terms/m/mobile-banking.asp.
Federal Deposit Insurance Corporation (2010-2020), “How America Banks: Household Use of Banking and Financial Services, 2019 FDIC Survey” FDIC EconomicInclusion.gov., https://www.fdic.gov/analysis/household-survey/2019/2019report.pdf
Frankenfield, Jake (2020), “Online Banking,” Investopedia, Retrieved from
https://www.investopedia.com/terms/o/onlinebanking.asp.
U.S. Small Business Administration. (2021). “Hispanic Heritage Month 2021.” Retrieved from https://www.sba.gov/about-sba/organization/observances/hispanic-heritage-month-2021.