
Latino Population Growth: Community Racial-Ethnic Makeup and Socioeconomic Well-Being in the Midwest

Introduction
Data from the 2020 Census in the United States show that the Latino population in the U.S. numbered about 62.1 million, representing 18.7% of the total population. Latinos are the second largest ethnic population in the country, next to White Americans. They are also the largest ethno-racial minority population, surpassing African Americans in over half of all U.S. metropolitan areas. The Latino population increased from 50.5 million in 2010 to 62.1 million in 2020, reflecting a growth rate of 23%.
In the Midwest, the Latino population in 2020 was about 6.0 million, or 8.7% of the total population. By comparison, Latinos comprised 15.3% of the population in the Northeast, 18.8% in the South, and 30.0% in the West. Between 2010 and 2020, the Latino population grew in all regions of the country. The Latino share of the growth of the population was highest in the Northeast (78.7%) followed by the Midwest (64%), and then the South (46.7%), and West (45.4%).
Although much has been written about Latinos in the Southwest and West, less is known about Latino recent migration and settlement in the Midwest. Latinos have settled in non-traditional metropolitan cities, suburbs, and in rural areas (Kandel & Parrado 2006). Kandel and Parrado (2006) found that the Latino population growth in nonmetropolitan county destinations represents one of the more profound social transformations affecting rural places, altering not only their social, economic, and political profiles, but also the broader national perception of rural and small-town America.
The objectives of this article are twofold: 1) To determine how the Latino population has changed over the last five decades in the U.S. and in the Midwest region, and 2) To determine how the increase of the Latino population has affected the ethnic makeup and community socioeconomic well-being of the Midwest.
Background
Historically, Latinos in the United States have concentrated in the largest metropolitan areas in the Southwest (Mexican Americans) and the Northeast (Puerto Ricans). The majority of Latinos have traditionally resided in five states: California, Texas, New York, Florida, and Illinois. Within those states, Latinos have tended to concentrate in gateway and ethnic hub cities such as Los Angeles, Houston, Dallas, New York City, Miami, and Chicago. More recently, Latinos have settled in new destination sites outside of traditional gateway metropolitan areas, particularly in the Midwest and Southeast, and in both metropolitan and nonmetropolitan areas. They were attracted by, or recruited for, employment opportunities in agriculture, meat packing, other food processing jobs, timber harvesting and processing, and other industries.
According to the 2020 Census, 47.4% of U.S. Latinos resided in 12 metropolitan areas with at least one million Latinos, including Los Angeles-Long Beach-Anaheim, CA; New York-Newark-Jersey City, NY-NJ-PA; Miami-Fort Lauderdale-Pompano Beach, FL; Houston-The Woodlands-Sugar Land, TX; Riverside-San Bernadino-Ontario, CA; Chicago-Naperville-Elgin, IL-IN-WI; Dallas-Fort Worth-Arlington, TX; Phoenix-Mesa-Chandler, AZ; San Antonio-New Braunfels, TX; San Diego-Chula Vista-Carlsbad, CA; Washington-Arlington-Alexandria, DC-VA-MD-WV; and San Francisco-Oakland-Berkeley, CA. In 2020, Latinos were also residing in other non-traditional metropolitan destination areas outside of the Southwest such as Atlanta-Sandy Springs-Alpharetta, GA.
The influx of Latinos in new destination communities does not occur by chance. They are pulled by employment opportunities in those areas, such as working on fruit and vegetable farms, dairy farms, and meat processing industries in the rural Midwest and Southeast (Kandel & Parrado 2005). Economic restructuring nationwide and globally and associated regulatory processes, including employment discrimination, layoffs, and community resistance are primary factors that push Latino workers to migrate to different regions in the United States, including the rural Midwest, in search of better opportunities. Other factors include lower housing costs and safer communities.
In the rural Midwest, increased mechanization and consolidation of farms, loss of union and skilled agricultural jobs, decline in local small businesses, and withdrawal of local state services (Sassen, 1990), and persistent poverty of rural communities contribute to the increased availability of low-wage and unprotected jobs. New agricultural businesses, such as the meat processing industries, tend not to hire local residents. Instead, they pursue the strategy of actively recruiting workers from other areas, including Latino, Asian, and African immigrant workers. Latino workers and their families have relocated to communities in the Midwest and have been becoming permanent members of those communities.
Data and Procedures
Data
Data come from the 1980, 1990, 2000, 2010 and 2020 decennial censuses, the 2019 one-year American Community Survey, and the 2015-2019 5-year American Community Survey produced by the U.S. Census Bureau. Data were retrieved from IPUMS-NHGIS (https://www.nhgis.org/) or from the U.S. Census Bureau (www.census.gov).
Analytic Strategy
First, the analysis provides a description of the population size by race/ethnicity, highlighting the share of the Latino population in the United States and the Midwest. Second, the analysis describes Latino population growth and the change in its share from 1980 to 2020. Third, an analysis of the age and sex composition of Latinos is compared to that of non-Hispanic Whites. The final analysis focuses on the Midwest region, mapping the concentration of Latinos in different communities of the Midwest, and linking the Latino share to community well-being and employment opportunity structures. That analysis uses descriptive statistics (means, standard deviations, and median) of demographic, socioeconomic well-being, and opportunity structures of four different community types: Established Latino counties, Rapid Growth Latino counties, Rapid Growth Non-Latino counties, and Slow Growth/Loss counties. For similar groupings of nonmetropolitan counties in the United States see Kandel and Parrado (2006).
We classify both metropolitan and nonmetropolitan counties in the Midwest using three factors: 1) The Latino proportion of county population in 2010, 2) the percent change in Latino population between 2010 and 2020, and 3) the overall total county population change between 2010 and 2020. Following definitions by Parrado & Kandel (2010), we create a county typology as follows: 1) Established Latino Counties are those in which the proportion of the Latino population in 2010 was at least 6.5% (mean + ½ SD); 2) Rapid Growth Latino Counties are those that had less than 6.5% Latino population in 2010, but their percent of Latinos increased by 2.1% between 2010 and 2020 (mean + ½ SD); 3) Rapid Growth Non-Latino Counties were less than 6.5% Latino in 2010, their percent Latino increased by less than 2.1% between 2010 and 2020, and experienced overall population growth between 2010 and 2020 of at least 3.3% (mean + ½ SD); and 4) Slow Growth or Loss Counties were less than 6.5% Latino in 2010, their percent Latino increased by less than 2.1% between 2010 and 2020, and experienced overall population growth between 2010 and 2020 of less than 3.3%. Our Midwest County typology is specified in Table 1.
|
County Type |
2010 Latino Population |
Latino Population Growth Rate, 2010 -2020 |
Percent Total Population Change, 2010-2020 |
|---|---|---|---|
|
Established Latino |
≥ 6.5% |
|
|
|
Rapid Growth Latino |
< 6.5% |
≥ 2.1% |
|
|
Rapid Growth Non-Latino |
< 6.5% |
< 2.1% |
≥ 3.3% |
|
Slow Growth & Declining Non-Latino |
< 6.5% |
< 2.1% |
< 3.3% |
Findings
Population Size and Racial/Ethnic Composition, 2020
According to the 2020 U.S. census, the U.S. population count was 331.4 billion as of April 1, 2020. The Latino population count was 62.1 million, representing 18.7% of the total population. In the Midwest, the total population count in 2020 was 69.0 million, and the Latino population count was 6.0 million, representing 8.7% of the total population in the region (Table 2). The non-Hispanic White population count in 2020 was 191.7 million (57.8%) in the U.S. and 50.1 million (72.6%) in the Midwest. The African American population count in 2020 was 39.9 million (12.1%) in the U.S. and 7.1 million (10.3%) in the Midwest. The Asian population count, including Native Hawaiian and other Pacific Islanders, was 20.2 million (6.1%) in the U.S. and 2.4 million (3.6%) in the Midwest. The American Indian or Alaska Native count was 2.3 million (0.7%) in the U.S. and 382.8 thousand (0.6%) in the Midwest.
|
Race and Ethnicity |
United States |
Midwest |
||
|---|---|---|---|---|
|
Number |
Percent |
Number |
Percent |
|
|
Total |
331,449,281 |
100.0 |
68,985,454 |
100.0 |
|
Hispanics or Latino |
62,080,044 |
18.7 |
5,978,786 |
8.7 |
|
Non-Hispanic White |
191,697,647 |
57.8 |
50,082,552 |
72.6 |
|
Black or African American |
39,940,338 |
12.1 |
7,111,553 |
10.3 |
|
American Indian and Alaska Native |
2,251,699 |
0.7 |
382,776 |
0.6 |
|
Asian |
19,618,719 |
5.9 |
2,385,691 |
3.5 |
|
Native Hawaiian and Other Pacific Islander |
622,018 |
0.2 |
38,022 |
0.1 |
|
Some other race |
1,689,833 |
0.5 |
242,361 |
0.4 |
|
Two or more Races |
13,548,983 |
4.1 |
2,763,713 |
4.0 |
Source: U.S. Census Bureau (1980, 1990, 2000, 2010, 2020). Data retrieved from IPUMS-NHGIS (https://www.nhgis.org/).
Population Size by Latino Specific Origin, 2020
Latinos are not a monolithic group. In 2019, 61.7% of Latinos in the U.S. were of Mexican origin, 13.3% were Central Americans, 9.7% Puerto Ricans, 7.8% South Americans, 3.8% Cubans, and 3.6% were Other Latinos. In the Midwest in 2019, 71.1% of Latinos were of Mexican origin, 10.8% were Puerto Ricans, 7.6% Central Americans, 5.6% South Americans, 3.3% Other Latinos, and 1.7% were Cuban Americans (Table 3).
|
Specific Origin |
United States |
Midwest |
||
|---|---|---|---|---|
|
Frequency |
Percent |
Frequency |
Percent |
|
|
Mexican |
33,697,519 |
61.72 |
3,629,830 |
71.05 |
|
Puerto Rican |
5,281,053 |
9.67 |
552,509 |
10.81 |
|
Cuban |
2,090,824 |
3.83 |
84,454 |
1.65 |
|
Central American |
7,268,909 |
13.31 |
386,776 |
7.57 |
|
South American |
4,281,322 |
7.84 |
287,526 |
5.63 |
|
Other Spanish/Hispanic/Latino |
1,973,648 |
3.62 |
167,911 |
3.29 |
|
Total |
54,593,275 |
100.00 |
5,109,006 |
100.00 |
Latino Population Change, 1980 to 2020
The U.S. Latino population increased steadily over the last five decades, increasing from 14.6 million in 1980 to 62.1 million people in 2020 (Figure 1). As a share of the U.S. population, Latinos continuously increased from 6.4% in 1980 to 18.7% in 2020 (Figure 2). Another way to look at the Latino population change is to compare the Latino share of the U.S. population growth in each decade. The Latino share of the growth of the U.S. population was 35.0% between 1980 and 1990, 39.6% between 1990 and 2000, 55.5% between 2000 and 2010, and 51.1% between 2010 and 2020 (Figure 3).
Figure 1: U.S. Latino Population Change, 1980 to 2020
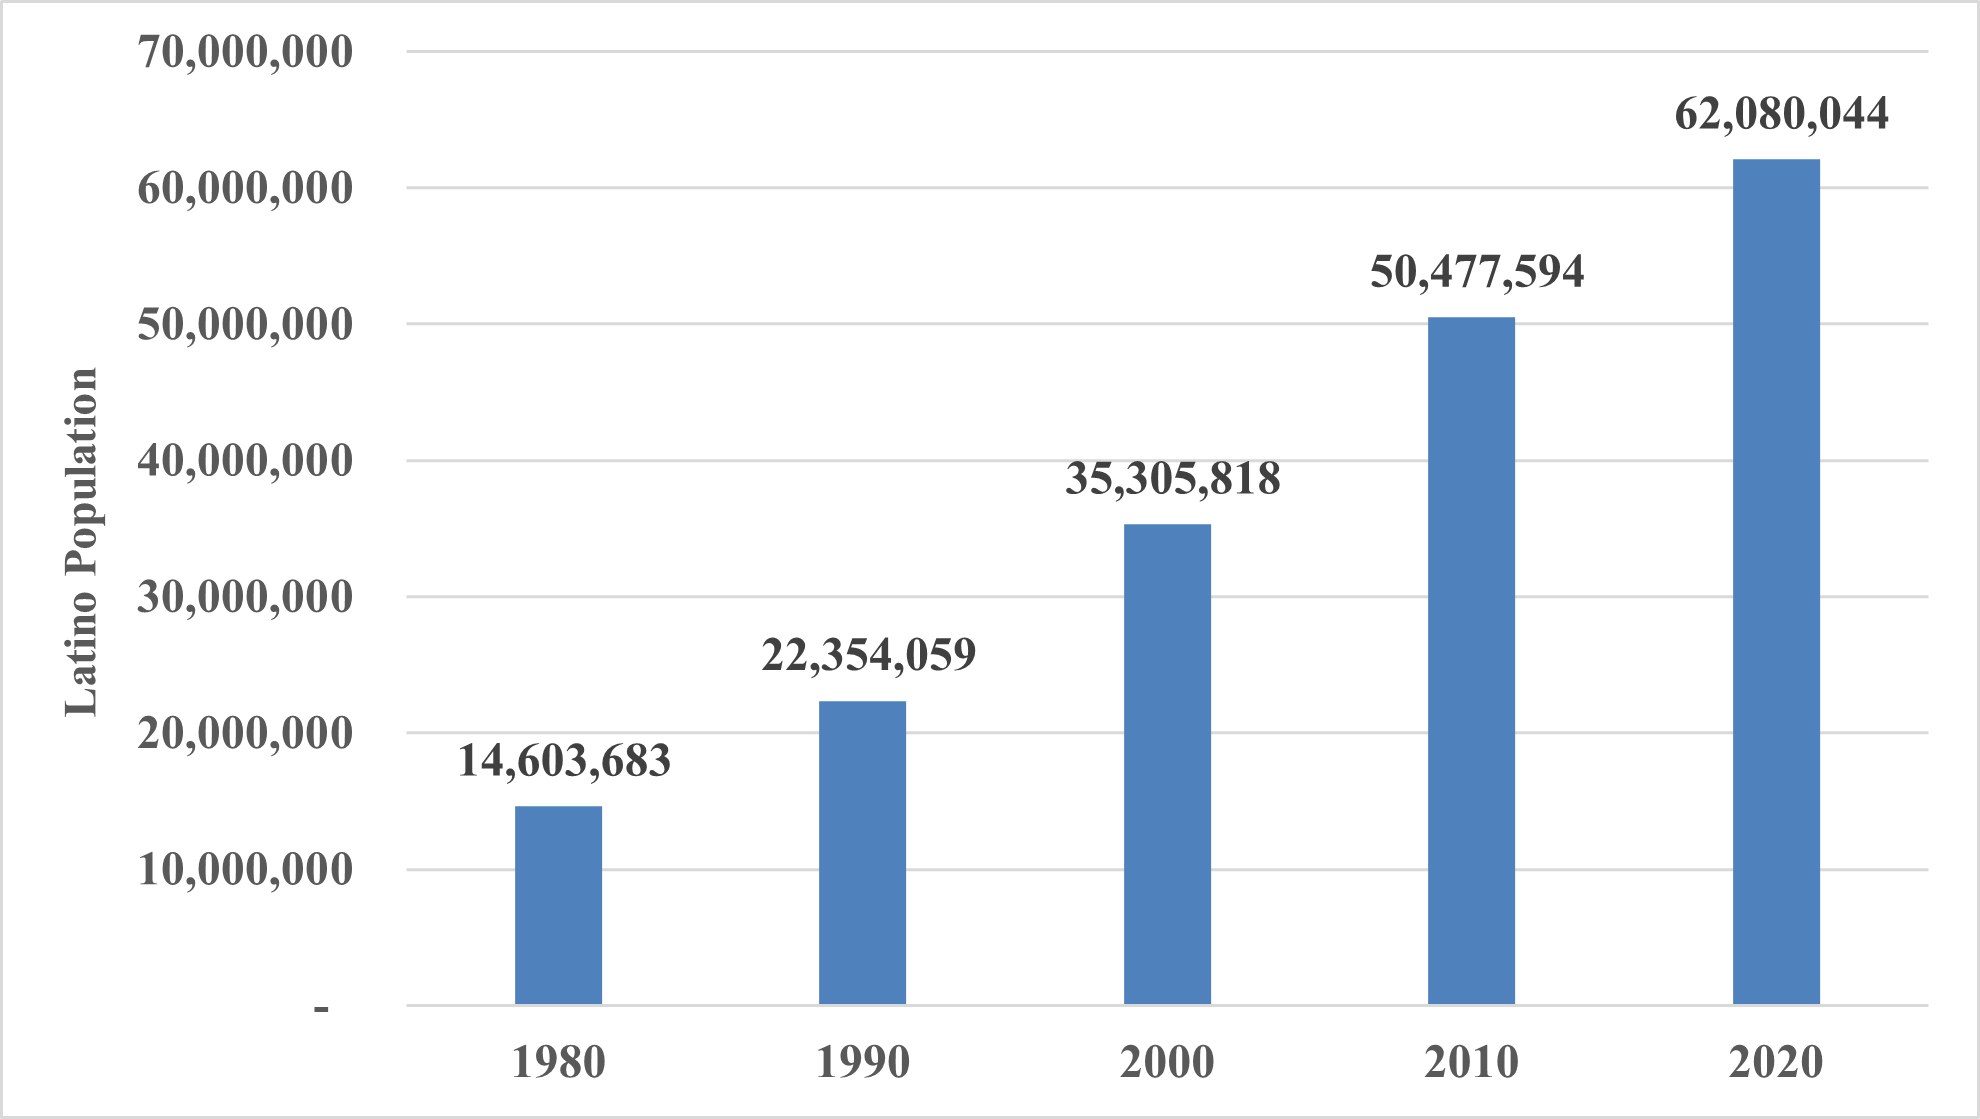
Source: U.S. Census Bureau (1980, 1990, 2000, 2010, 2020). Data retrieved from IPUMS-NHGIS (https://www.nhgis.org/).
Figure 2: Percent of U.S. Population Latino, 1980 to 2020
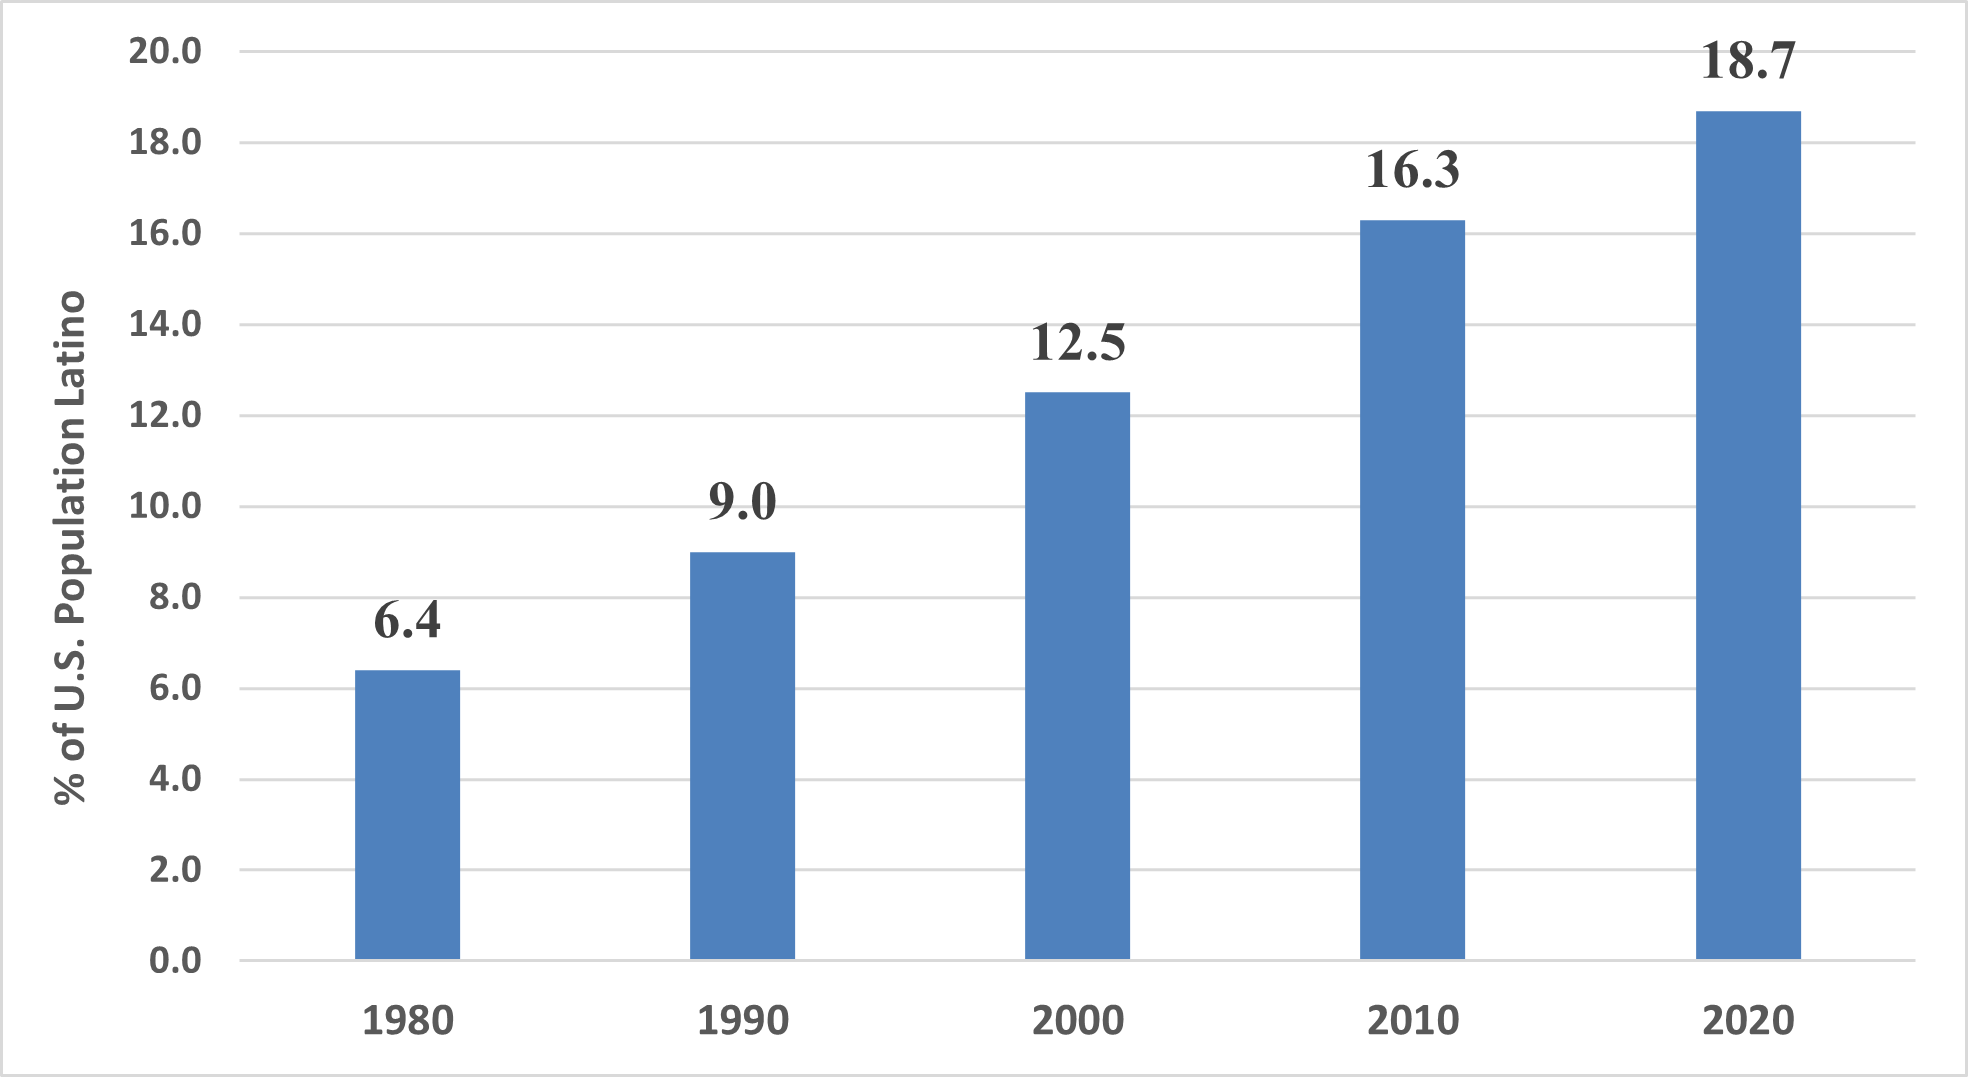
Source: U.S. Census Bureau (1980, 1990, 2000, 2010, 2020). Data retrieved from IPUMS-NHGIS (https://www.nhgis.org/).
Figure 3: Latino Percentage share of U.S. Population Growth
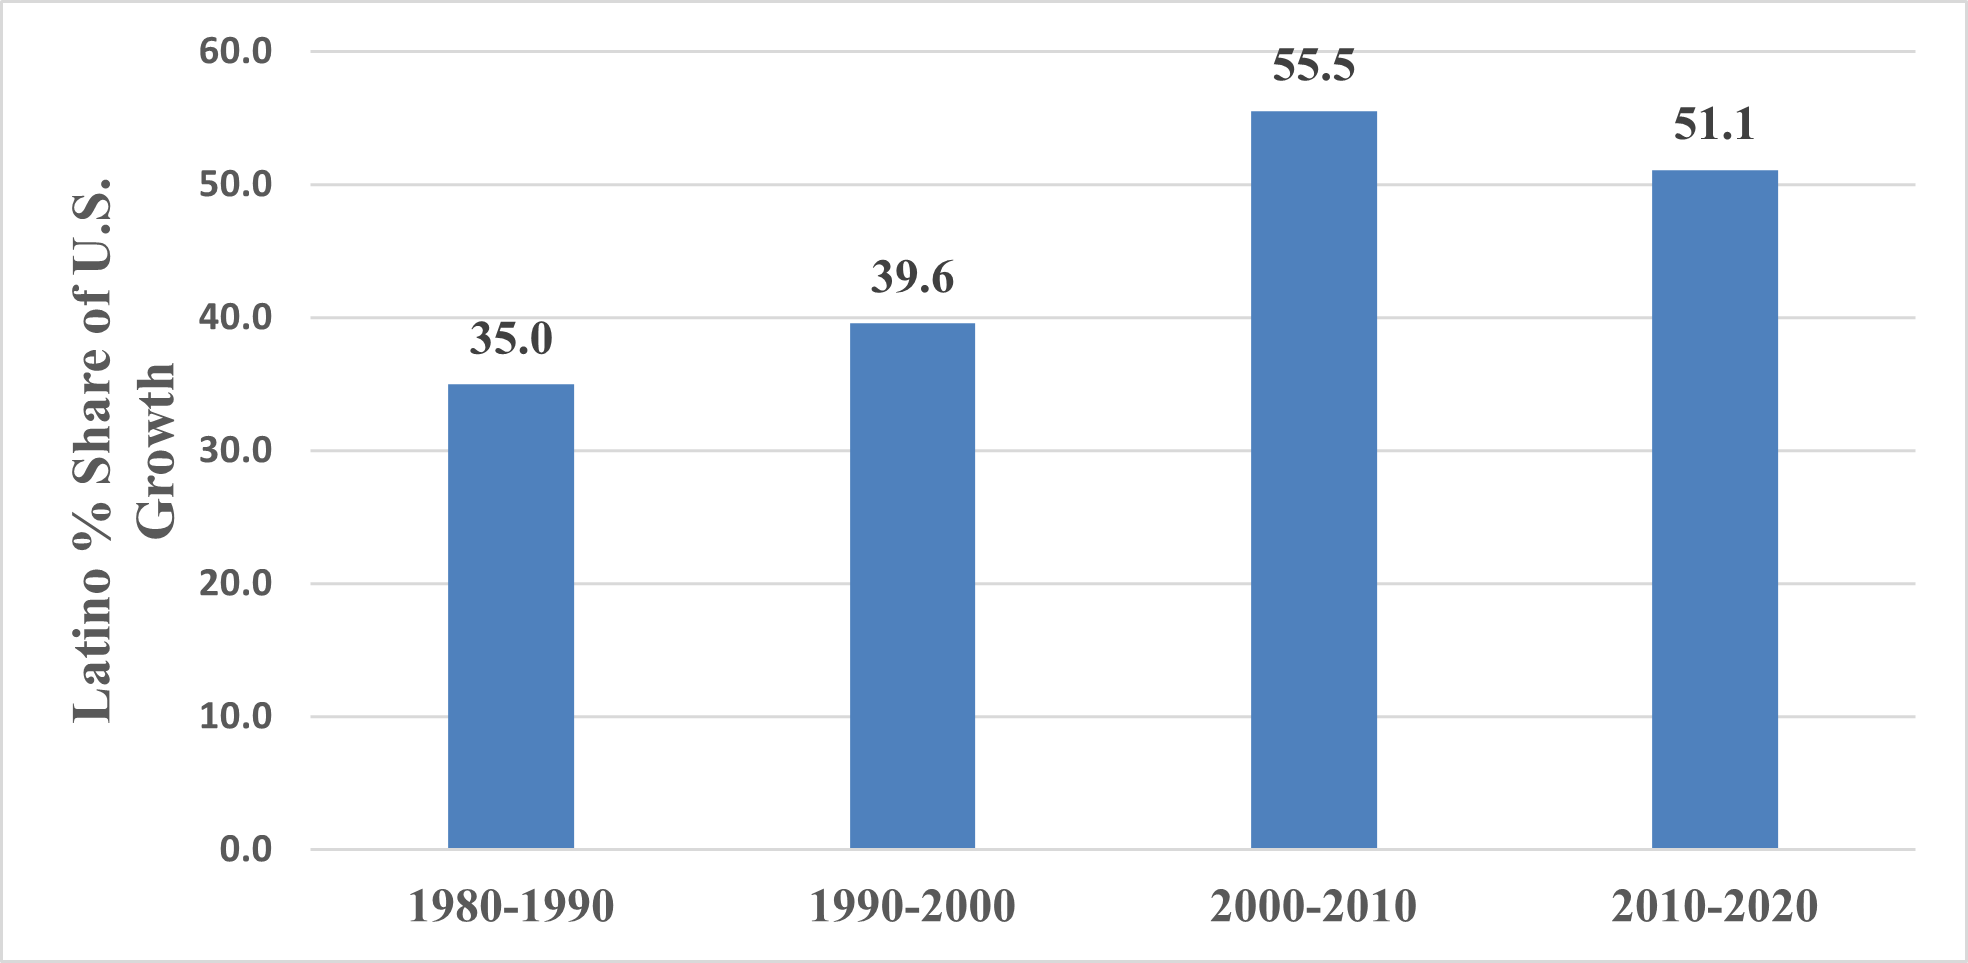
Source: U.S. Census Bureau (1980, 1990, 2000, 2010, 2020). Data retrieved from IPUMS-NHGIS (https://www.nhgis.org/).

The Latino population in the Midwest region also increased steadily over the last five decades, increasing from 1.3 million in 1980 to 6.0 million in 2020 (Figure 4). The percent of the Midwest Latino population increased from 2.2% in 1980 to 8.7% in 2020 (Figure 5). In 2020, the percent of the Latino population in the Midwest is highest in the state of Illinois, followed by Kansas, Nebraska, Indiana, and Wisconsin (Figure 6).
Figure 4. Midwest Latino Population Change, 1980 to 2020
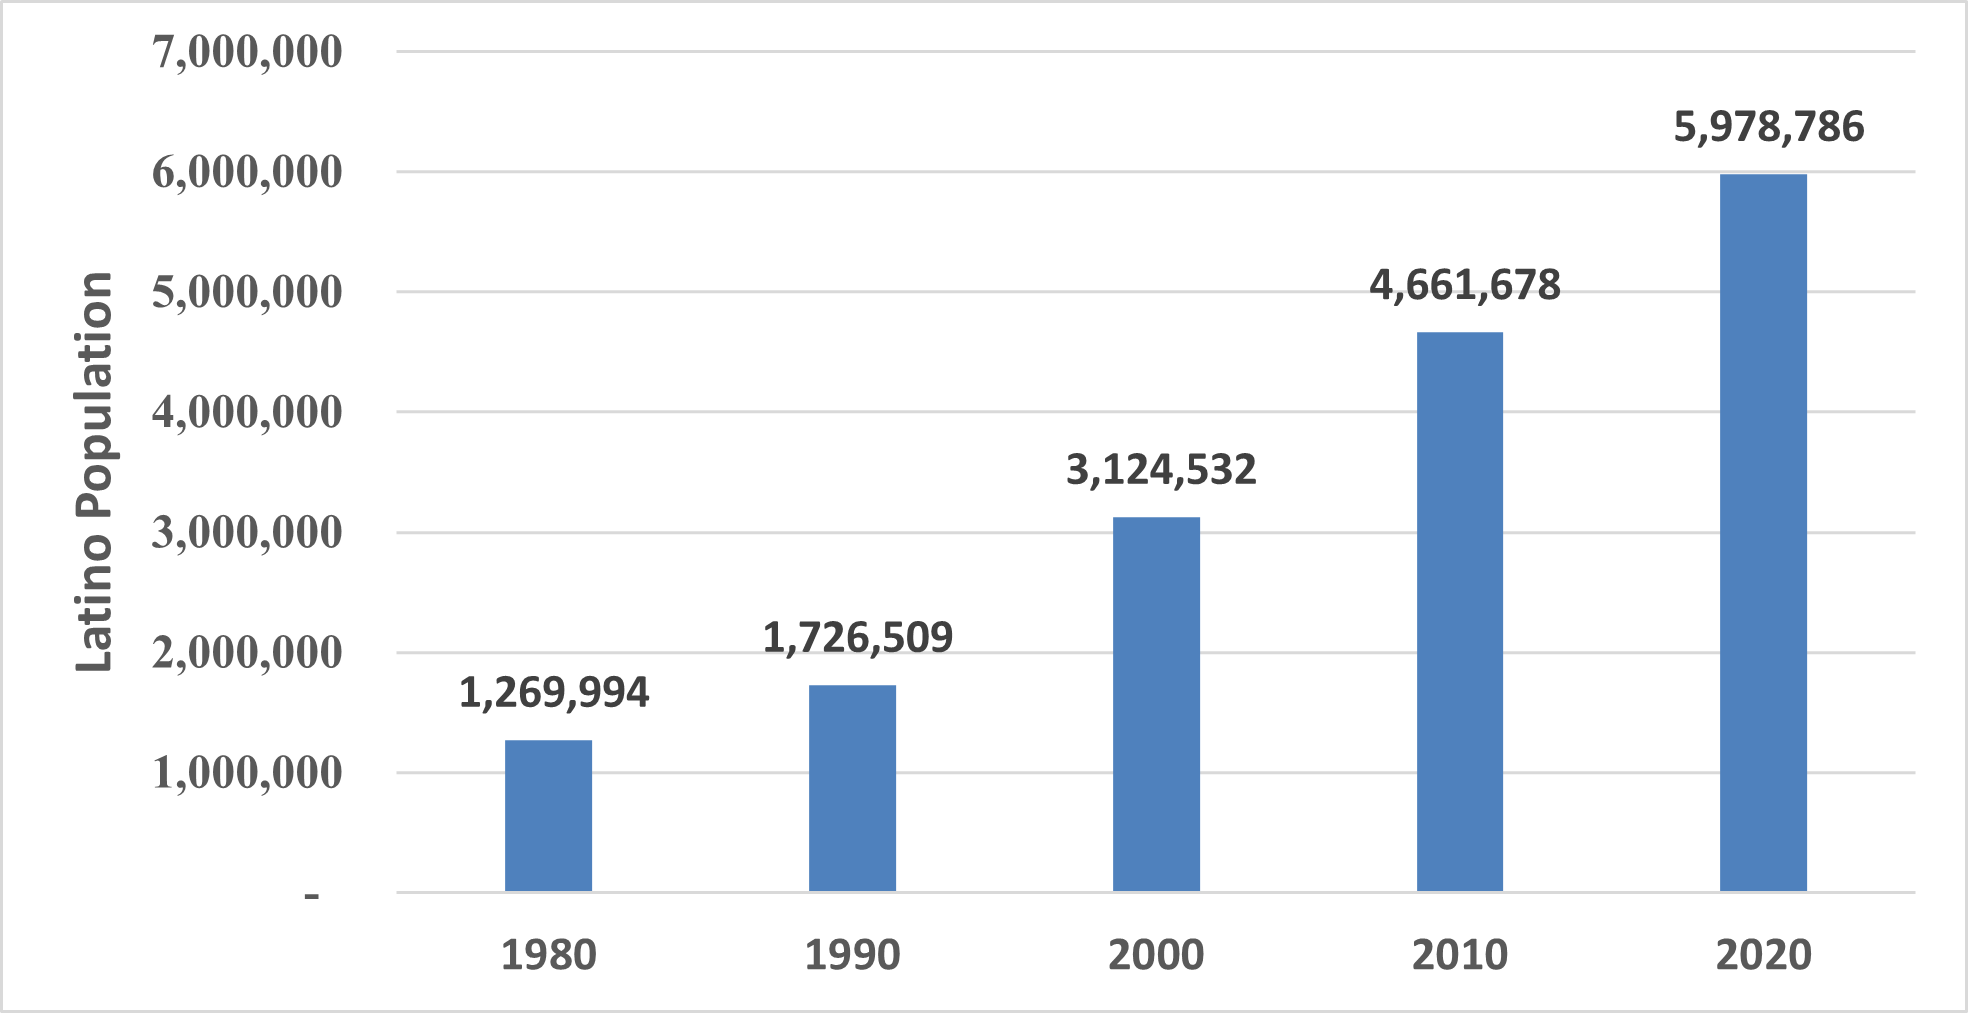
Source: U.S. Census Bureau (1980, 1990, 2000, 2010, 2020). Data retrieved from IPUMS-NHGIS (https://www.nhgis.org/).
Figure 5: Percent of Midwest Population Latino, 1980 to 2020
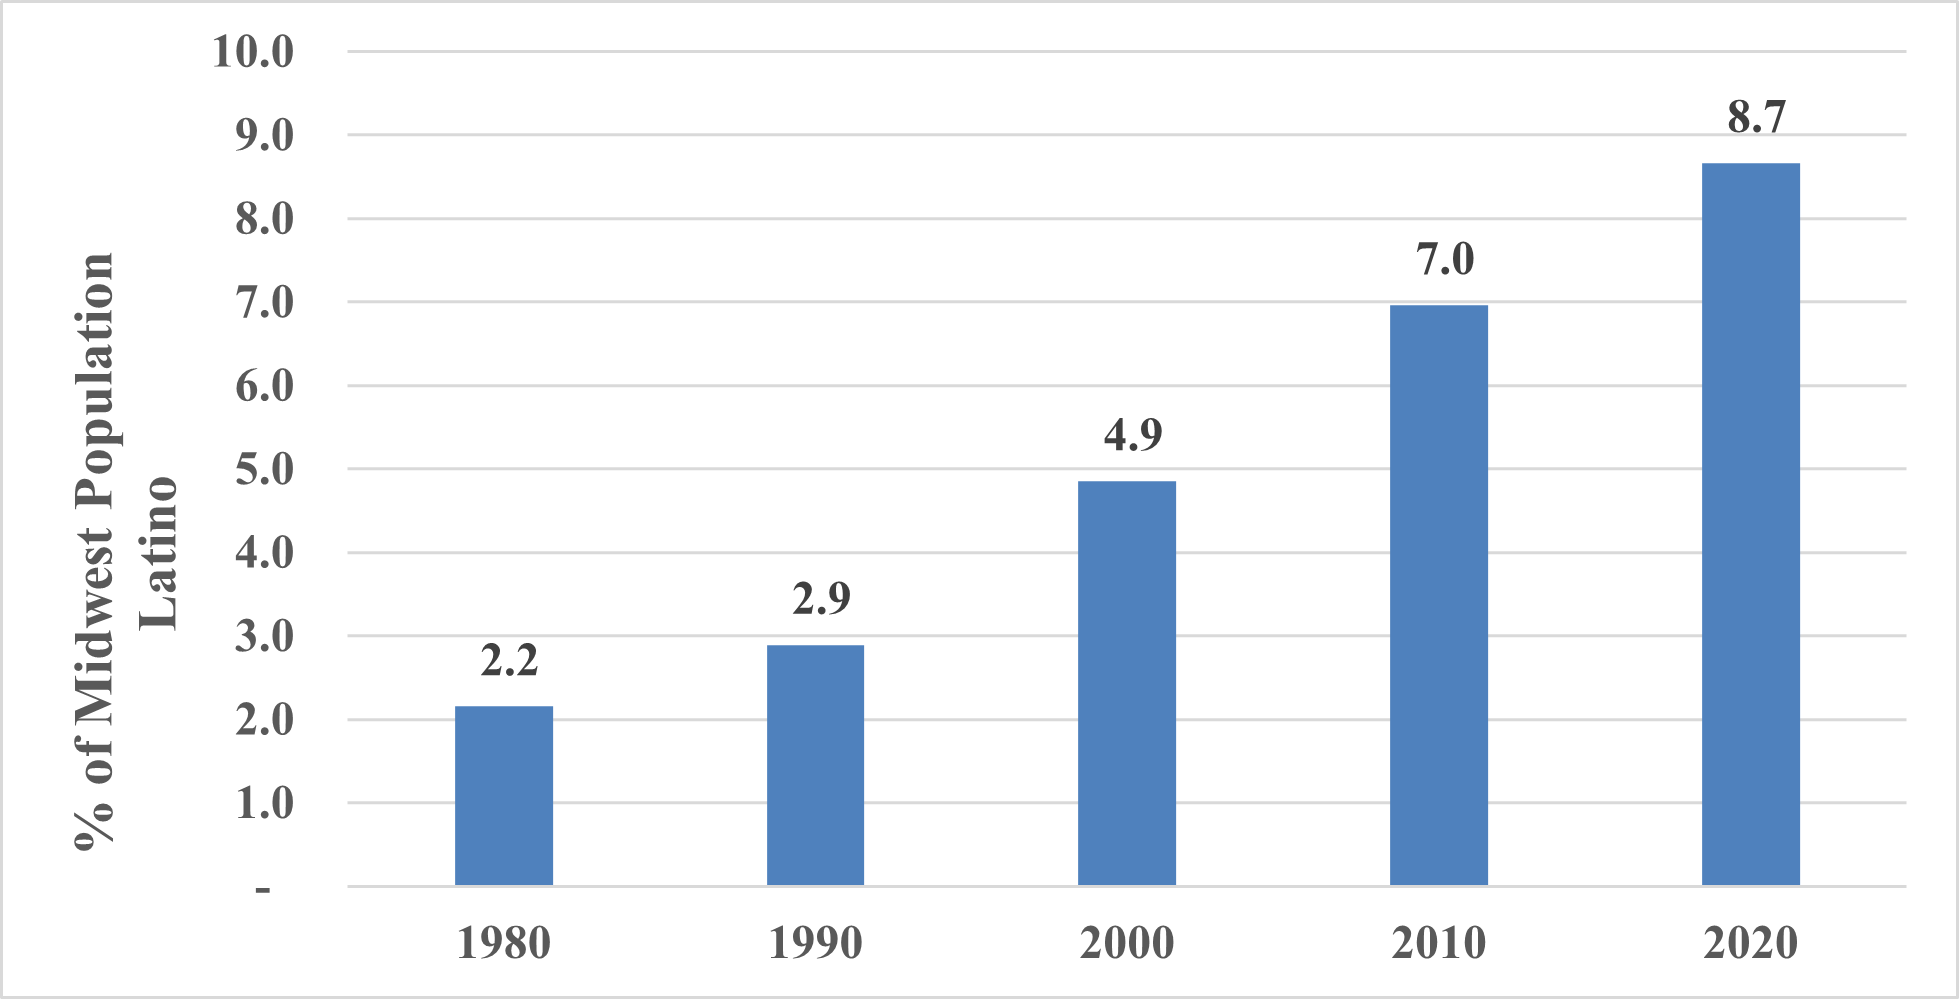
Source: U.S. Census Bureau (1980, 1990, 2000, 2010, 2020). Data retrieved from IPUMS-NHGIS (https://www.nhgis.org/).
Figure 6: Percent of Midwest Population Latino by State 2020
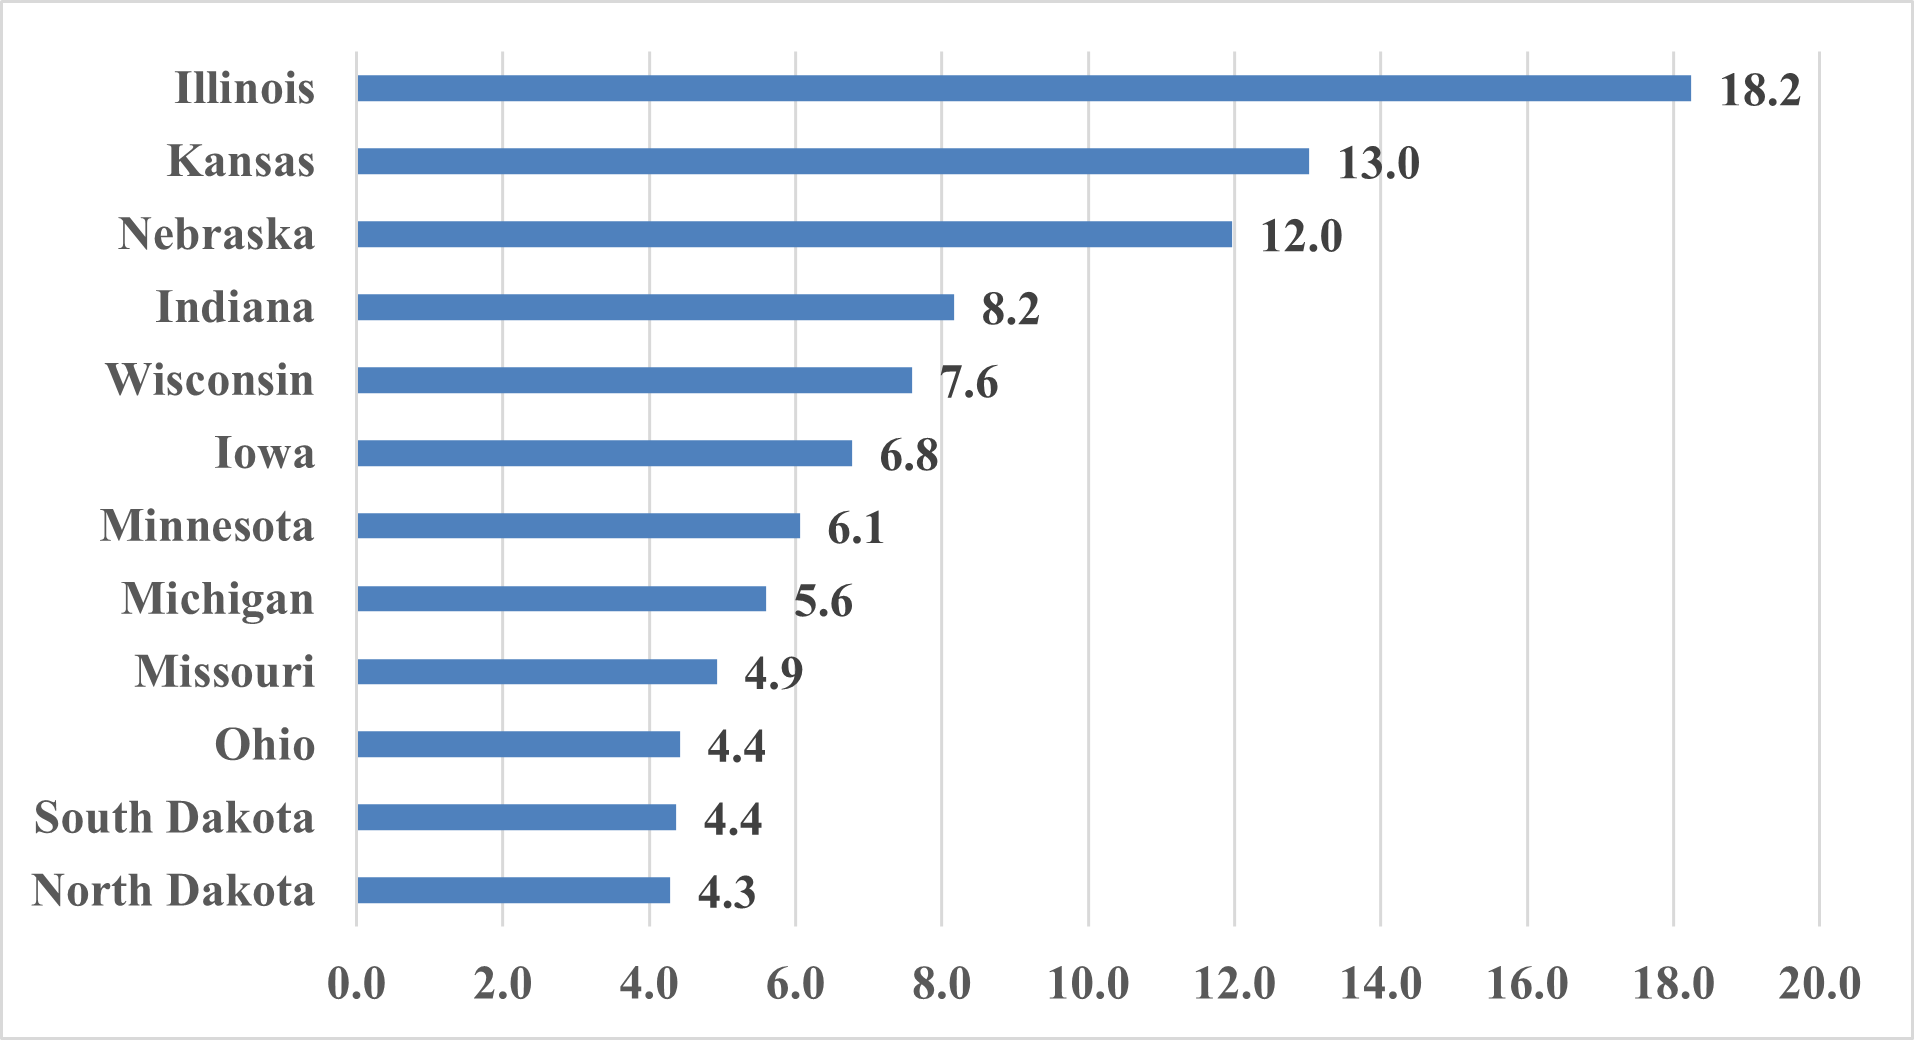
Source: U.S. Census Bureau (1980, 1990, 2000, 2010, 2020). Data retrieved from IPUMS-NHGIS (https://www.nhgis.org/).
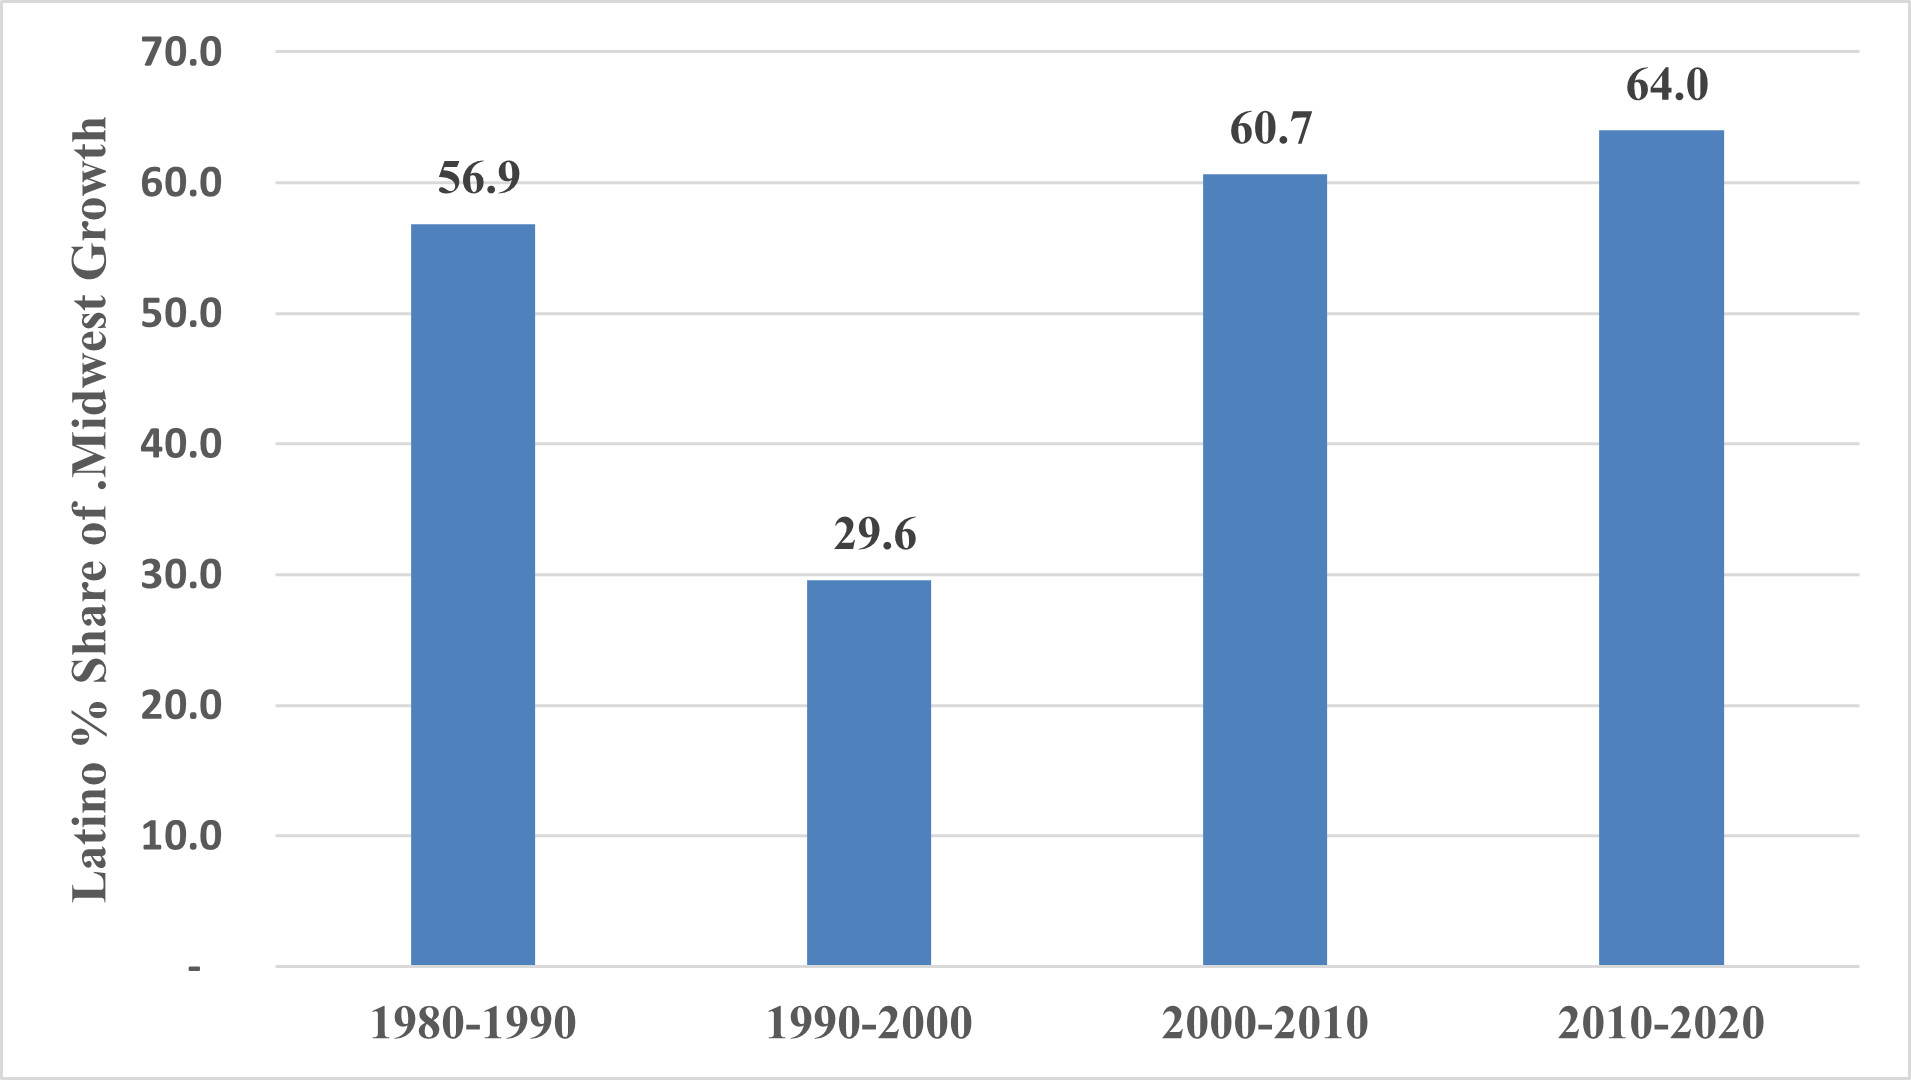
The Latino share of the growth of the Midwest population was 56.9% between 1980 and 1990, 29.6% between 1990 and 2000, 60.7% between 2000 and 2010, and 64.0% between 2010 and 2020 (Figure 7).
Figure 7: Latino Percentage share of Midwest Population Growth
Source: U.S. Census Bureau (1980, 1990, 2000, 2010, 2020). Data retrieved from IPUMS-NHGIS (https://www.nhgis.org/).
U.S. and Midwest Population Change by Race/Ethnicity, 2010 to 2020
This section focuses only on the population change by race/ethnicity in the last decade (2010–2020). U.S. population change in the last decade is mostly attributable to, on one hand, the growth of Latino and Asian populations and, on the other hand, the decline of the non-Hispanic White population. The Latino population in the U.S. grew from 50.5 million people in 2010 to 62.1 million in 2020, or a gain of 23.0%. The Latino percentage share of U.S. population growth was 51.1%. The Asian population, excluding Native Hawaiian and Pacific Islander, increased from 14.5 million in 2010 to 19.6 million in 2020, an increase of 35.6%. The Asian percentage share of the U.S. population growth was 22.7%. In contrast, the non-Hispanic White population decreased from 196.8 million in 2010 to 191.7 million in 2020, a decrease of 2.6%. The non-Hispanic White percentage share of the U.S. population growth was -22.6% (Table 4).
|
Race and Ethnicity |
2010 |
2020 |
Change 2010-2020 |
||||
|---|---|---|---|---|---|---|---|
|
Number |
% |
Number |
% |
Number |
% Change |
% Share |
|
|
Total |
308,745,538 |
100.0 |
331,449,281 |
100.0 |
22,703,743 |
7.4 |
100.0 |
|
Hispanics or Latino |
50,477,594 |
16.3 |
62,080,044 |
18.7 |
11,602,450 |
23.0 |
51.1 |
|
Non-Hispanic White |
196,817,552 |
63.7 |
191,697,647 |
57.8 |
-5,119,905 |
-2.6 |
-22.6 |
|
Black or African American |
37,685,848 |
12.2 |
39,940,338 |
12.1 |
2,254,490 |
6.0 |
9.9 |
|
American Indian and Alaska Native |
2,247,098 |
0.7 |
2,251,699 |
0.7 |
4,601 |
0.2 |
0.0 |
|
Asian |
14,465,124 |
4.7 |
19,618,719 |
5.9 |
5,153,595 |
35.6 |
22.7 |
|
Native Hawaiian and Other Pacific Islander |
481,576 |
0.2 |
622,018 |
0.2 |
140,442 |
29.2 |
0.6 |
|
Some other race |
604,265 |
0.2 |
1,689,833 |
0.5 |
1,085,568 |
179.7 |
4.8 |
|
Two or more Races |
5,966,481 |
1.9 |
13,548,983 |
4.1 |
7,582,502 |
127.1 |
33.4 |
Source: U.S. Census Bureau (1980, 1990, 2000, 2010, 2020). Data retrieved from IPUMS-NHGIS (https://www.nhgis.org/).
In the Midwest region, population change is mostly attributable to the decline of the non-Hispanic White population and the increase of Latino and Asian populations. Between 2010 and 2020, the Midwest population increased from 66.9 million in 2010 to 69.0 million in 2020, representing a gain in population of 2.1 million (3.1%). The Latino population in the Midwest increased from 4.7 million in 2010 to almost 6.0 million in 2020, representing a gain of 1.3 million Latinos (28.3%). The Latino percentage share of the Midwest population growth was 64.0%. The Midwest region also experienced an increase in Asian populations of about 672.2 thousand (+39.2%). In contrast, the non-Hispanic White population decreased from 52.1 million in 2010 to 50.1 million in 2020, a population loss of 2.0 million non-Hispanic Whites, or 3.9%. The vast majority (97.8%) of population loss in the Midwest was due to non-Hispanic Whites (Table 5).
|
Race and Ethnicity |
2010 |
2020 |
Change 2010-2020 |
||||
|---|---|---|---|---|---|---|---|
|
Number |
% |
Number |
% |
Number |
% Change |
% Share |
|
|
Total |
66,927,001 |
100.0 |
68,985,454 |
100.0 |
2,058,453 |
3.1 |
100.0 |
|
Hispanics or Latino |
4,661,678 |
7.0 |
5,978,786 |
8.7 |
1,317,108 |
28.3 |
64.0 |
|
Non-Hispanic White |
52,096,633 |
77.8 |
50,082,552 |
72.6 |
-2,014,081 |
-3.9 |
-97.8 |
|
Black or African American |
6,843,367 |
10.2 |
7,111,553 |
10.3 |
268,186 |
3.9 |
13.0 |
|
American Indian and Alaska Native |
388,068 |
0.6 |
382,776 |
0.6 |
-5,292 |
-1.4 |
-0.3 |
|
Asian |
1,713,429 |
2.6 |
2,385,691 |
3.5 |
672,262 |
39.2 |
32.7 |
|
Native Hawaiian and Other Pacific Islander |
24,932 |
0.0 |
38,022 |
0.1 |
13,090 |
52.5 |
0.6 |
|
|
|
|
|
|
|
|
|
|
Some other race |
73,096 |
0.1 |
242,361 |
0.4 |
169,265 |
231.6 |
8.2 |
|
Two or more Races |
1,125,798 |
1.7 |
2,763,713 |
4.0 |
1,637,915 |
145.5 |
79.6 |
Source: U.S. Census Bureau (1980, 1990, 2000, 2010, 2020). Data retrieved from IPUMS-NHGIS (https://www.nhgis.org/).
Migration plays the most important role in redistributing the Midwest region population. The natural increase (births minus deaths) remained almost constant (an annual average above 3 per 1,000 population) from 2010 to 2016 but declined thereafter (an annual average below 3 people per 1,000 population). The rate of international migration also remained constant from 2010 to 2016 (an annual average of close to 2 people per 1,000 population) and then continually declined thereafter. The rate of internal migration has continuously been negative, suggesting that overall the Midwest region continues to lose population (Figure 8). Most people moved out of the Midwest between 2014 and 2016 (an annual average loss of about 3 people per 1,000 population). The internal migration of population in the Midwest can be attributable to changes in economic conditions over the last decade (Figure 8).
Figure 8: Components of Midwest Population Change, 2010-2019
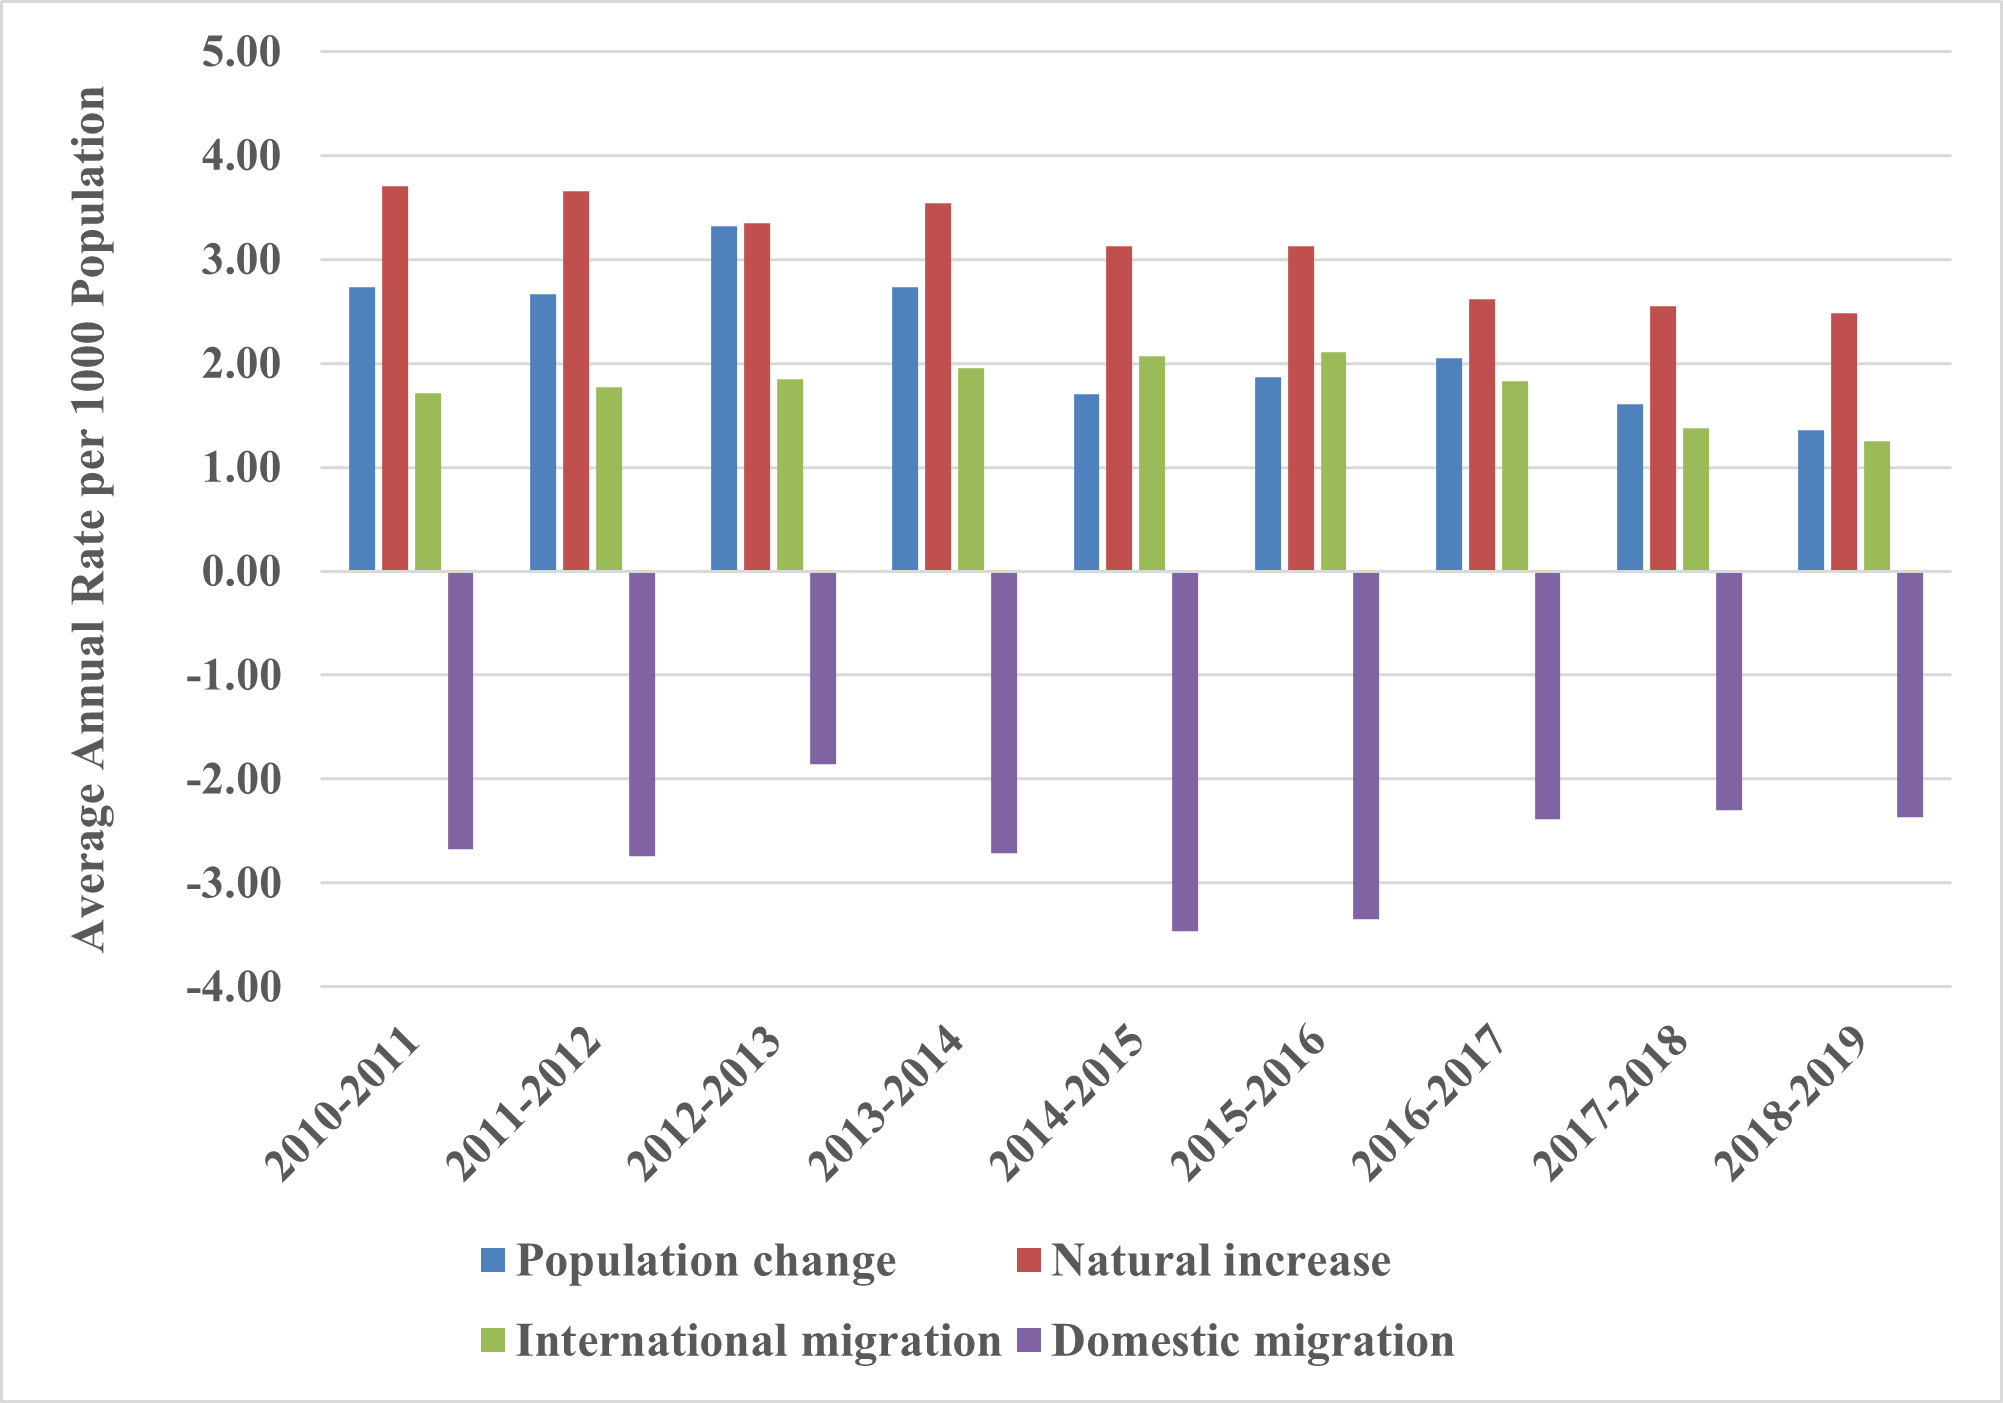
Source: U.S. Census Bureau, Annual Population Estimates: April 1, 2010 to July 1, 2019.
Age and Sex Composition
The age-sex composition of the Latino and non-Hispanic White populations is similar in both the United States and the Midwest region. The following section only presents the age-sex composition for the U.S. The Latino population is younger than the non-Hispanic White population. In 2020, 30.8% of the Latino population in the U.S. was under 18 years of age, compared to 18.6% of the non-Latino White population. Few Latinos were 65 years of age and older (7.7%) compared to non-Latino Whites (20.2%) (Figure 9).
Figure 9: U.S. Latino and non-Hispanic White Population by Age Groups, 2020
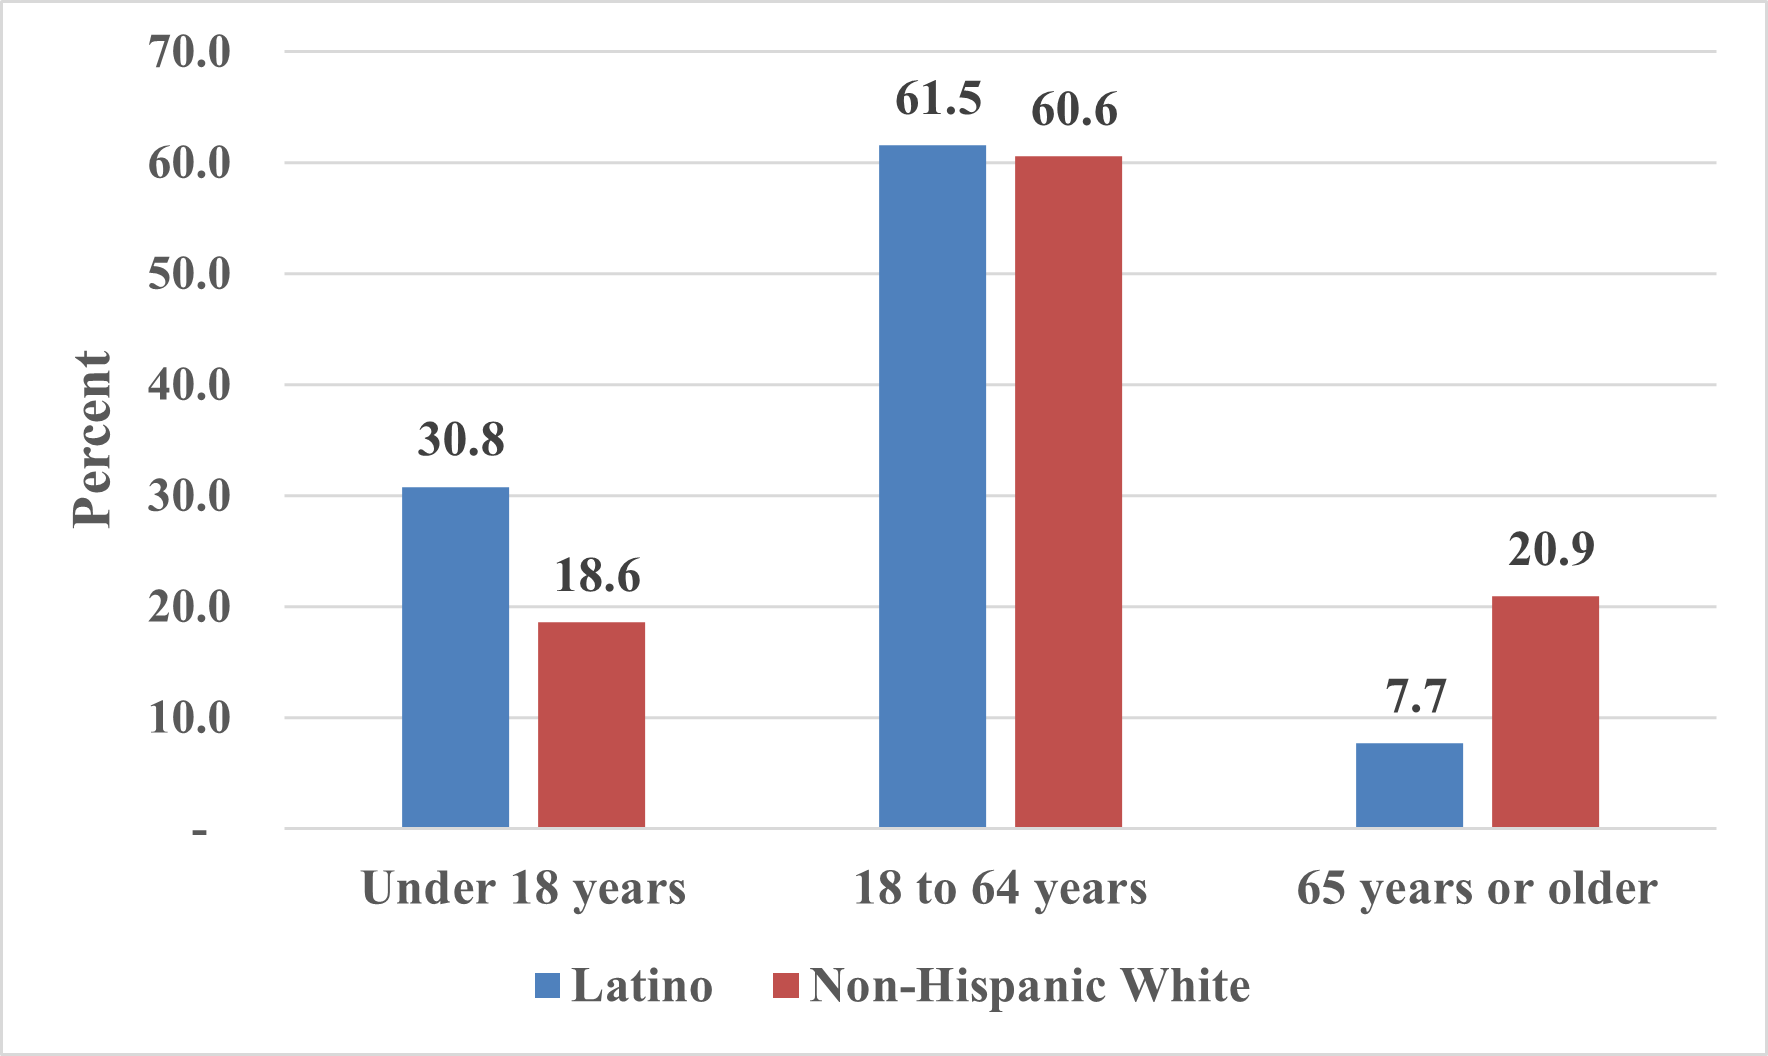
Source: U.S. Census Bureau. American Community Survey 1-year Estimates, Data retrieved from IPUMS-NHGIS (https://www.nhgis.org/).
Table 6 displays the median age by sex, race, and ethnicity in 2020 in the United States. The median age in 2020 for Latinos was 29.8 years (29.3 years for males and 30.3 years for females), compared to the median age for non-Hispanic Whites of 43.7 years (42.3 years for males and 45.3 years for females).
|
|
Both sexes |
Male |
Female |
|---|---|---|---|
|
Latinos or Hispanics |
29.8 |
29.3 |
30.3 |
|
Non-Hispanic White |
43.7 |
42.3 |
45.3 |
|
Black or African American |
34.8 |
32.9 |
36.5 |
|
American Indian and Alaska Native |
33.9 |
32.6 |
35.3 |
|
Asian |
37.9 |
36.4 |
39.2 |
|
Native Hawaiian and Other Pacific Islander |
32.7 |
32.1 |
33.3 |
|
Some other race |
30.5 |
30.3 |
30.8 |
|
Two or more Races |
20.8 |
20.4 |
21.3 |
Source: U.S. Census Bureau, 2019 American Community Survey 1-Year Estimates, Data retrieved from IPUMS-NHGIS (https://www.nhgis.org/).
The age and sex distributions for the Latino and non-Latino White populations for 2019 in the United States are displayed in the population pyramids (Figure 10). The shapes of the pyramids indicate a much younger Latino population compared to the non-Hispanic White population, which is top heavy. The Latino population pyramid shows larger proportions at younger ages and progressively smaller proportions at older age. The wider base of the pyramid reflects relatively higher proportions of young Latinos. In contrast, the non-Hispanic White pyramid has a much more rectangular shape, which indicates an older population. The base of the non-Latino pyramid is narrower, reflecting relatively fewer young people. The non-Hispanic White pyramid also reveals a larger proportion of older age groups.
The Latino pyramid also reveals a larger proportion of individuals under 10 years of age for Latinos (16.7% for males, 15.7% for females) as compared to non-Hispanic Whites (10.5% for males, 9.6% for females. Whereas 18.7% of males and 17.3% females of the Latino population were ages 10 to 24, only 11.3% of males and 10.2% of females for the non-Hispanic White population were within this age group. About 29.5% of males and 29.8% of females for the Latino population were ages 25 to 44 as compared to 24.7% of males and 24.1% of females for the non-Hispanic White population in this age group. Among Latinos, 20.4% of males and 21.2% of females were 45 to 64 years of age, while 28.4% of males and 28.5% of females of non-Hispanic Whites were in that age group. Relatively few Latinos (7.0% of males and 8.8% of females) were age 65 and older compared with non-Hispanic Whites (19.9% of males and 22.8% of females) (Figure 10). The younger age composition of the Latino population likely reflects the continued migration to the United States. The non-Latino White pyramid reveals the aging of the baby-boom generation with a much greater proportion of older groups (65 years and older) than Latinos.
Figure 10: U.S. Latino and Non-Hispanic White Population Pyramids
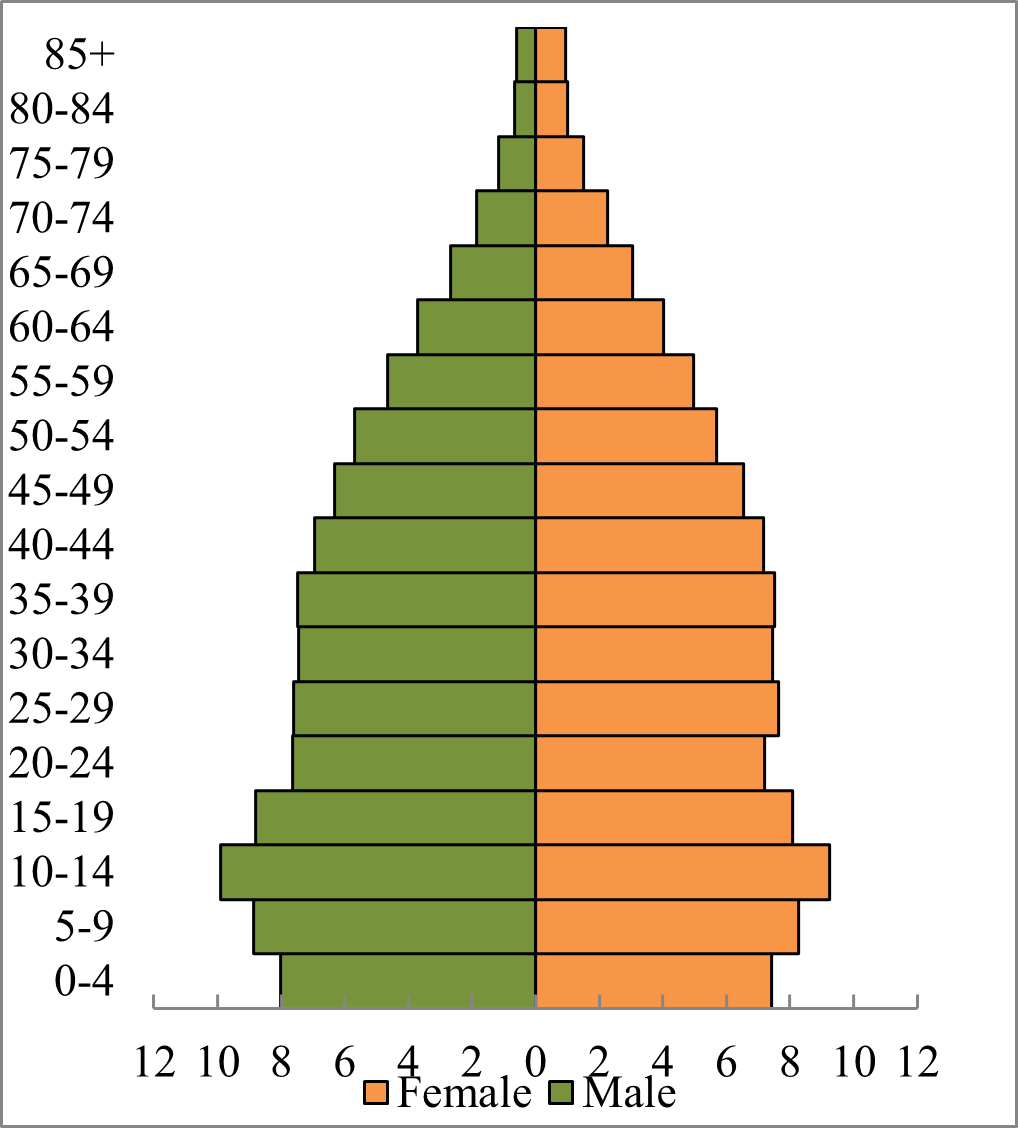
Source: U.S. Census Bureau, 2019 American Community Survey 1-Year Estimates.
The Spatial Distribution of Latino Population in the Midwest by County, 2020
Figure 11 shows a map of the Midwest that displays the total Latino population by county in 2020. The map displays the concentration of Latinos in each county in the Midwest. The largest concentration of Latinos in the Midwest is in Cook County, Illinois (1,382, 778), a long standing Established Latino area in Chicago metropolitan areas. Other metropolitan counties in 2020 with over 100,000 Latinos include Lake, Illinois (171,962), Kane, Illinois (169,595), Milwaukee, Wisconsin (153,017), DuPage, Illinois (144,291), Will, Illinois (130,851), Marion, Indiana (129,286), and Wayne County, Michigan (117,649). The map also shows nonmetropolitan counties with substantial numbers of Latinos (over 10,000), including Finney, Kansas (19,883), Ford, Kansas (19,666), Seward, Kansas (14,406), Walworth, Wisconsin (12,550), and LaSalle, Illinois (11,456) (Figure 11).
Figure 11: Map of the Latino Population in the Midwest, 2020
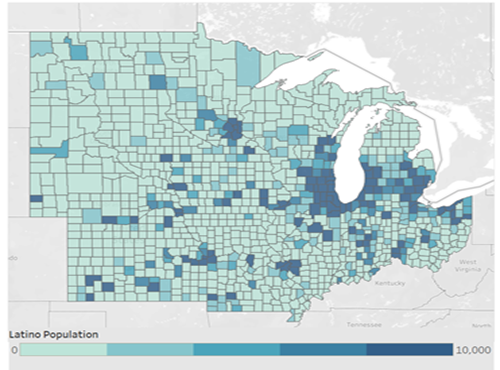
Table 7 provides descriptive statistics (means and standard deviations) of demographic characteristics by county type. The total population in 2020 and population change in the last decade in the Midwest were significantly different in the four types of counties. The average total population in 2020 in Established Latino counties was 164,281, compared with 35,306 in Rapid Growth Latino, 119,747 in Rapid Growth Non-Latino, and 36,578 in Slow Growth or Loss counties. The total population in the Established Latino counties decreased on average by 0.72% compared with 2.7% in Rapid Growth Latino and 9.0% in Rapid Growth Non-Latino counties. Slow Growth or Loss counties decreased in their population by almost 4%. As expected, based on the definition of these county types provided above, Established Latino counties had the largest average Latino population in 2020 (27,824) of any county type.
|
Total (N = 1,054) |
Established Latino (N = 144) |
Rapid Growth Latino (N = 89) |
Rapid Growth Non-Latino (N = 146) |
Slow Growth/Loss (N = 675) |
||||||||||||||||||
|---|---|---|---|---|---|---|---|---|---|---|---|---|---|---|---|---|---|---|---|---|---|---|
|
Mean |
Std. Dev. |
Mean |
Std. Dev. |
Mean |
Std. Dev. |
Mean |
Std. Dev. |
Mean |
Std. Dev. |
|||||||||||||
|
Demographics |
|
|
|
|
|
|
|
|
|
|
|
|||||||||||
|
Total population, 2010 |
63,485 |
210,378 |
158,428 |
472,322 |
33,327 |
66,836 |
109,227 |
176,949 |
37,312 |
106,348 |
|
|||||||||||
|
Total population, 2020 |
65,438 |
216,241 |
164,281 |
483,766 |
35,306 |
72,589 |
119,747 |
192,469 |
36,578 |
105,183 |
|
|||||||||||
|
Percent population change, 2010-2020 |
-1.00 |
8.52 |
-0.72 |
5.94 |
2.73 |
18.088 |
9.01 |
6.89 |
-3.85 |
4.61 |
|
|||||||||||
|
Latino population, 2010 |
4,423 |
40,093 |
23,030 |
106,124 |
1,495 |
3,575 |
3,530 |
7,057 |
1,032 |
4,767 |
|
|||||||||||
|
Latino population, 2020 |
5,672 |
45,084 |
27,824 |
118,583 |
2,590 |
5,585 |
5,491 |
10,923 |
1,392 |
6,151 |
|
|||||||||||
|
% Latino, 2010 |
3.79 |
5.37 |
13.68 |
9.29 |
3.48 |
1.60 |
2.53 |
1.37 |
1.98 |
1.23 |
|
|||||||||||
|
% Latino, 2020 |
5.15 |
6.39 |
16.88 |
10.71 |
6.83 |
2.17 |
3.63 |
1.67 |
2.76 |
1.50 |
|
|||||||||||
|
Latino change, 2010 - 2020 |
1.37 |
1.44 |
3.19 |
2.18 |
3.34 |
1.44 |
1.11 |
0.48 |
0.77 |
0.56 |
||||||||||||
|
% Foreign born, 2020 |
2.99 |
3.50 |
8.45 |
5.87 |
3.42 |
2.17 |
3.41 |
2.68 |
1.68 |
1.24 |
|
|||||||||||
|
% non-Hispanic White, 2020 |
85.70 |
12.07 |
72.65 |
12.56 |
85.50 |
7.17 |
85.90 |
6.95 |
88.46 |
11.53 |
|
|||||||||||
|
% Black, 2020 |
2.44 |
4.50 |
4.16 |
5.57 |
1.95 |
3.69 |
2.98 |
3.90 |
2.02 |
4.37 |
|
|||||||||||
|
% Asian, 2020 |
0.96 |
1.52 |
1.93 |
2.48 |
1.00 |
1.67 |
1.83 |
2.01 |
0.56 |
0.74 |
|
|||||||||||
|
% Native Americans, 2020 |
1.93 |
8.47 |
0.53 |
0.94 |
1.20 |
3.45 |
1.45 |
3.07 |
2.43 |
10.37 |
|
|||||||||||
|
% < 18 years, 2020 |
22.58 |
3.07 |
24.46 |
2.43 |
23.04 |
2.70 |
22.99 |
3.14 |
22.02 |
3.04 |
|
|||||||||||
|
% ≥ 65 years, 2020 |
19.48 |
4.20 |
16.71 |
3.15 |
19.33 |
4.29 |
17.11 |
4.29 |
20.60 |
3.87 |
|
|||||||||||
|
% non-metropolitan, 2020 |
71.35 |
45.24 |
65.28 |
47.78 |
86.52 |
34.35 |
33.56 |
47.38 |
78.81 |
40.89 |
|
|||||||||||
The Rapid Growth Latino and Established Latino counties experienced about 3% Latino increase compared with Rapid Growth Non-Latino and Slow Growth or Loss counties that experienced 1% or less increase between 2010 and 2020. In 2020, Established Latino counties had the highest proportion of foreign-born populations than in other county types (8.5%). By comparison, Rapid Growth Latino and Rapid Growth Non-Latino counties had 3.4% while Slow Growth or Loss counties had 1.7% foreign-born populations.
Established Latino counties have the highest percentage of Blacks than any other county type. On average, the percent Black in Established Latino counties was 4.2% in 2020 compared with 2.0% in Rapid Growth Latino, 3.0% in Rapid Growth Non-Latino, and 2.0% in Slow Growth or Slow counties. The percent Asian was also highest in Established Latino counties. On average, the percent Asian was 1.9% in Established Latino counties, 1.8% in Rapid Growth Non-Latino counties, 1.0% in Rapid Growth Latino counties, and 0.6% in Slow Growth or Loss counties.
Established Latino counties on average had lower percentages of non-Latino White populations (72.7%) than Rapid Growth Latino (85.5%), Rapid Growth Non-Latino (85.9%), and Slow Growth or Loss counties (88.5%). Established Latino counties have on average a greater percentage of their population under 18 years of age (24.5%), whereas the Slow Growth or Loss counties had the lowest (22.0%). Both Rapid Growth Latino and Rapid Growth Non-Latino counties had about 23.0% of their populations under 18 years of age. In sharp contrast, Slow Growth or Loss counties had the highest percentage (20.6%) of people 65 years of age and older of any county type. Rapid Growth Latino counties had on average 19.3% of people aged 65 years and older, followed by Rapid Growth Non-Latino counties (17.1%) and Established Latino counties (16.7%).
Most counties in the Midwest are overrepresented in nonmetropolitan (71.4%) than in metropolitan (28.6%) areas. Rapid Growth Latino counties were overwhelmingly nonmetropolitan counties (86.5%), followed by Slow Growth counties (78.8%). By comparison, 65.3% of Established Latino counties and only 33.6% of Rapid Growth Non-Latino counties were in nonmetropolitan areas.
The next analysis highlights differences in socioeconomic and employment opportunity structures of Midwest counties by county typology (Table 8). The average unemployment rate in 2020 was 4.3% in Slow Growth or Loss counties, 4.1% in Established Latino, 3.4% in Rapid Growth Non-Latino, and 3.2% in Rapid Growth Latino counties. This is consistent with the expectation that employment opportunities attract Latino population growth in these new destinations.
|
|
Total (N = 1,054) |
Established Latino (N = 144) |
Rapid Latino Growth (N = 89) |
Rapid non-Latino growth (N = 89) |
Slow Growth/Loss (N = 675) |
||||||||||||||||||
|---|---|---|---|---|---|---|---|---|---|---|---|---|---|---|---|---|---|---|---|---|---|---|---|
|
Mean/ median |
Std. Dev. |
Mean/ median |
Std. Dev. |
Mean/ median |
Std. Dev. |
Mean/ median |
Std. Dev. |
Mean/ median |
Std. Dev. |
||||||||||||||
|
Educational attainment |
|
||||||||||||||||||||||
|
% with a high school diploma or equivalent |
35.17 |
6.39 |
31.61 |
6.16 |
33.75 |
5.82 |
29.67 |
6.23 |
37.30 |
5.37 |
|
||||||||||||
|
% with a college degree or higher |
21.93 |
7.66 |
23.26 |
8.13 |
23.10 |
7.08 |
30.05 |
9.99 |
19.73 |
5.47 |
|||||||||||||
|
Employment and Income |
|
||||||||||||||||||||||
|
% unemployed, 2020 |
4.08 |
2.28 |
4.05 |
1.50 |
3.18 |
1.64 |
3.43 |
1.22 |
4.34 |
2.59 |
|||||||||||||
|
% in poverty, 2020 |
12.62 |
5.25 |
12.10 |
3.56 |
11.37 |
3.59 |
9.81 |
3.80 |
13.50 |
5.73 |
|||||||||||||
|
% of households receiving public assistance, 2020 |
2.13 |
1.71 |
1.77 |
0.88 |
1.78 |
1.17 |
1.86 |
0.89 |
2.31 |
1.99 |
|||||||||||||
|
% Housing owner, 2020 |
73.86 |
7.00 |
70.51 |
7.15 |
71.49 |
7.39 |
74.02 |
8.00 |
74.85 |
6.37 |
|||||||||||||
|
% Affluent, 2020 |
34.47 |
8.06 |
36.33 |
7.50 |
35.00 |
7.64 |
43.02 |
8.64 |
32.15 |
6.62 |
|||||||||||||
|
Median household income ($) * |
54,194 |
|
56,274 |
|
54,012 |
|
63,693 |
|
52,288 |
|
|||||||||||||
|
Per capita income ($)* |
28,842 |
|
28,709 |
|
30,127 |
|
32,940 |
|
27,951 |
|
|||||||||||||
|
Occupation and Industry |
|
||||||||||||||||||||||
|
% core industries 1 |
41.14 |
6.46 |
42.57 |
6.16 |
39.31 |
7.72 |
40.92 |
6.15 |
41.12 |
6.34 |
|||||||||||||
|
% periphery industries 1 |
41.23 |
7.37 |
39.41 |
6.96 |
44.57 |
8.62 |
38.43 |
6.40 |
41.78 |
7.21 |
|||||||||||||
|
% primary occupations 1 |
41.53 |
6.20 |
40.82 |
6.43 |
42.52 |
5.79 |
46.80 |
7.04 |
40.40 |
5.36 |
|||||||||||||
|
% secondary/farm Occupations 4 |
56.82 |
5.89 |
57.30 |
6.05 |
55.90 |
5.60 |
51.80 |
6.84 |
57.92 |
5.04 |
|||||||||||||
* Median.
1Core industries include: mining, quarrying, and oil extraction; construction; manufacturing; wholesale trade; transportation and warehousing, and utilities; information; finance and insurance, real estate, and rental and leasing; and professional, scientific, management, administrative, and waste management services.
2Periphery industries include: agriculture, forestry, and fishing and hunting; retail trade; education services; health care and social assistance.
3Primary occupations include: management, business, and financial; and sales and related occupations. 4 Secondary/farm occupations include: service; office and administrative support; natural resources, construction, and maintenance; and production, transportation, and material moving occupations.
Rapid Growth Latino and Rapid Growth Non-Latino counties exhibited lower poverty rates (3.6%) than Slow Growth or Loss (13.5%) and Established Latino counties (12.1%). The percentage of households receiving public assistance on average was highest in Slow Growth/Loss counties (2.3%), followed by Rapid Growth Non-Latino counties (1.9%). Established Latino and Rapid Growth Latino counties had the lowest proportion of households receiving public assistance (1.8%). Housing ownership was lowest in Established Latino counties (70.5%) as compared to Rapid Growth Latino (71.5%), Rapid Growth Non-Latino (74.0%), and Slow Growth or Loss counties, which had the highest housing ownership rate (74.9%).
Rapid Growth Non-Latino counties had the highest average proportion of residents with a college degree or higher (30.0%). The lowest average college educational attainment was in Slow Growth or Loss counties (19.7%). About 23% of residents in Established Latino and Rapid Growth Latino counties had a college degree or higher. In terms of high school diploma or equivalent, the highest average proportion was 37.3% in Slow Growth or Loss counties, followed by 33.8% in Rapid Growth Latino, 31.6% in Established Latino, and 29.7% in Rapid Growth Non-Latino counties.
The median household income was highest in the Rapid Growth Non-Latino counties ($63,693), followed by that of Established Latino ($56,274). By comparison, the median household income in Rapid Growth Latino counties was $54,012 and the lowest was in Slow Growth or Loss counties ($52,288). The median per-capita income was highest in Rapid Growth Non-Latino ($32,040) counties, followed by that in Rapid Growth Latino counties ($30,127). Established Latino counties had a median per capita income of $28,709, while Slow Growth or Loss counties had a median per-capita income of $27,951. On average, the highest average proportion of affluent residents (i.e., with a household income of $75,000 or higher) was in Rapid Growth Non-Latino counties.
The opportunity structures of these four types of counties differ significantly. Employment in core industries was lowest in Rapid Growth Latino counties as compared to all other county types. Employment in core industries was, on average, 39.2% in Rapid Growth Latino counties, 40.9% in Rapid Growth Non-Latino counties, 41.1% in Slow Growth or Loss counties, and 42.6% in Established Latino counties.
In contrast, employment in periphery industries was higher in Rapid Growth Latino counties (44.6%), followed by Slow Growth or Loss counties (41.8%), Established Latino counties (39.4%), and Rapid Growth Non-Latino counties (38.4%).
In terms of occupation, Rapid Growth Non-Latino counties exhibited higher average proportions of civilian population 16 years of age and older employed in primary occupations (46.8%), followed by Rapid Growth Latino counties (42.5%), Slow Growth or Loss counties (40.4%), and Established Latino counties (40.8%). Secondary/farm occupations were highest in Slow Growth or Loss counties (57.9%), followed by Established Latino counties (57.3%), Rapid Growth Latino counties (55.9%), and Rapid Growth Non-Latino counties (51.8%).
Discussion and Conclusion
The Latino population in the U.S. has increased significantly from 14.6 million in 1980 to 62.1 million in 2020, an increase of 325%. In 2020, Latinos represented 18.7% of the U.S. population, almost three times the Latino share of the U.S. population than in 1980 (6.4%).
In the last decade (2010-2020), over one-half of the share of the U.S. population growth is attributable to Latinos compared to 35% between 1980 and 1990. In 2020, the size of the Latino population was about 1.5 times higher than the African American population and almost one third of the non-Hispanic White population. Natural increase is a vital component of Latino population growth. The other is international migration. The Latino population has become more diverse over time and is comprised of Mexican Americans and Mexican origin peoples (over 60%), Cubans, Puerto Ricans, Central Americans, South Americans, and Other Latinos. Compared to non-Latino Whites, Latinos are a much younger population. In 2020, 30.8% of the Latino population was younger than 18 years of age compared to 18.6% of non-Latino Whites. Relatively few Latinos were age 65 and older (7.7%) compared to non-Latino Whites (20.2%).
The Midwest region is one of the growing destinations outside of established Latino gateways and regional ethnic hubs in the Southwest, West, and Northeast regions of the country. The Latino population in the Midwest has steadily increased over the last five decades, growing from 1.3 million in 1980 to almost 6 million in 2020, having nearly quadrupled during those 40 years. In 2020, the share of the Midwest Latino population was highest in the state of Illinois, especially in the Chicago metropolitan area. Latinos also increased in nonmetropolitan counties in Kansas, Iowa, Nebraska, Wisconsin, Illinois, Indiana, and Michigan. The Midwest population change is mostly attributable to the increase of the Latino population.
How did the Latino population change in the last decade relate to the socioeconomic well-being of their new settlement communities in the Midwest? Rapid Growth Latino and Rapid Growth Non-Latino counties had lower poverty rates compared to Established Latino and Slow Growth or Loss counties. The median per-capita income was highest in Rapid Growth Non-Latino counties, followed in order by Rapid Growth Latino, Established Latino, and Slow Growth or Loss counties. These results suggest that Rapid Growth Non-Latino counties have, on average, relatively more prosperous communities than the other three other types of counties. This is evident when one considers the median household income, which is highest in the Rapid Growth Non-Latino Counties, followed by the Established Latino and Rapid Growth Latino counties, with the lowest median household income being in Slow Growth or Loss counties. Rapid Growth Non-Latino counties also have the highest average proportion of affluent and college educated residents.
Our analysis shows that Rapid Growth Latino counties, which are mostly rural counties, had lower unemployment rates, suggesting that employment opportunities generate Latino population growth in those areas. This may also suggest that employment opportunities are greater in those new destinations. However, a closer look at types of jobs finds that primary occupations, which on average pay more than secondary/farm occupations, were on average higher in Rapid Growth Non-Latino counties, followed by Rapid Growth Latino, than in Slow Growth or Loss and in Established Latino counties. Secondary or farm occupations were, on average, found more in Slow Growth or Loss and in Established Latino counties than in Rapid Growth Latino and Rapid Growth Non-Latino counties.
The types and quality of available jobs found in communities matter. Employment opportunities in core industries were lowest in Rapid Growth Latino compared to other community types. Not surprisingly, employment opportunities in periphery industries were also highest in Rapid Growth Latino counties. This is consistent with the economic restructuring of occupation and industries of recent decades which suggest that the newly created jobs that attract Latinos to new destinations in the rural Midwest are those requiring lesser skills and offering relatively lower wages and are concentrated in periphery industries which may do little to alleviate Latino economic disadvantage.
Latino population growth is also affecting the ethnic makeup of Midwestern communities. The Latino population is relatively young compared to non-Latino populations and is likely to continue to increase, given their high fertility levels, even during times of reduced international migration. These results suggest that continued Latino population growth in new destination communities as in the Midwest will likely require assistance programs to promote their integration, including information regarding schools, childcare, churches, hospitals, banks, state service agencies, and immigration laws, etc. The increasing number of Latinos in new destination communities contributes to the local economy through payroll taxes, social security withholdings, spending in local businesses and, importantly, new business startups. Work policies that emphasize creating good jobs (i.e., jobs that pay a living wage) would help alleviate poverty and overall social and economic disadvantage, thereby improving community well-being. Finally, work policies that give workers the bargaining power to negotiate the terms of their employment are beneficial to both workers and companies.
References
Harrison, B., & Bluestone, B. (1987). Dark side of labour market” flexibility”: falling wages and growing income inequality in America (No. 992575113402676). International Labour Organization.
Kandel, W., & Parrado, E. A. (2005). Restructuring of the US meat processing industry and new Hispanic migrant destinations. Population and Development Review, 31(3), 447.471.
Kandel, W. A., & Parrado, E. A. (2006). Rural Hispanic population growth. In W. A. Kandel & D. L. Brown (eds), Population change and rural society (pp. 155-175). Springer, Dordrecht.
Parrado, E. A., & Kandel, W. A. (2010). Hispanic population growth and rural income inequality. Social Forces, 88(3), 1421-1450.
Sassen, S. (1990). Economic restructuring and the American city. Annual review of sociology, 16(1), 465-490.